
Technical analysis for FTSE 100 for 23rd September 2025
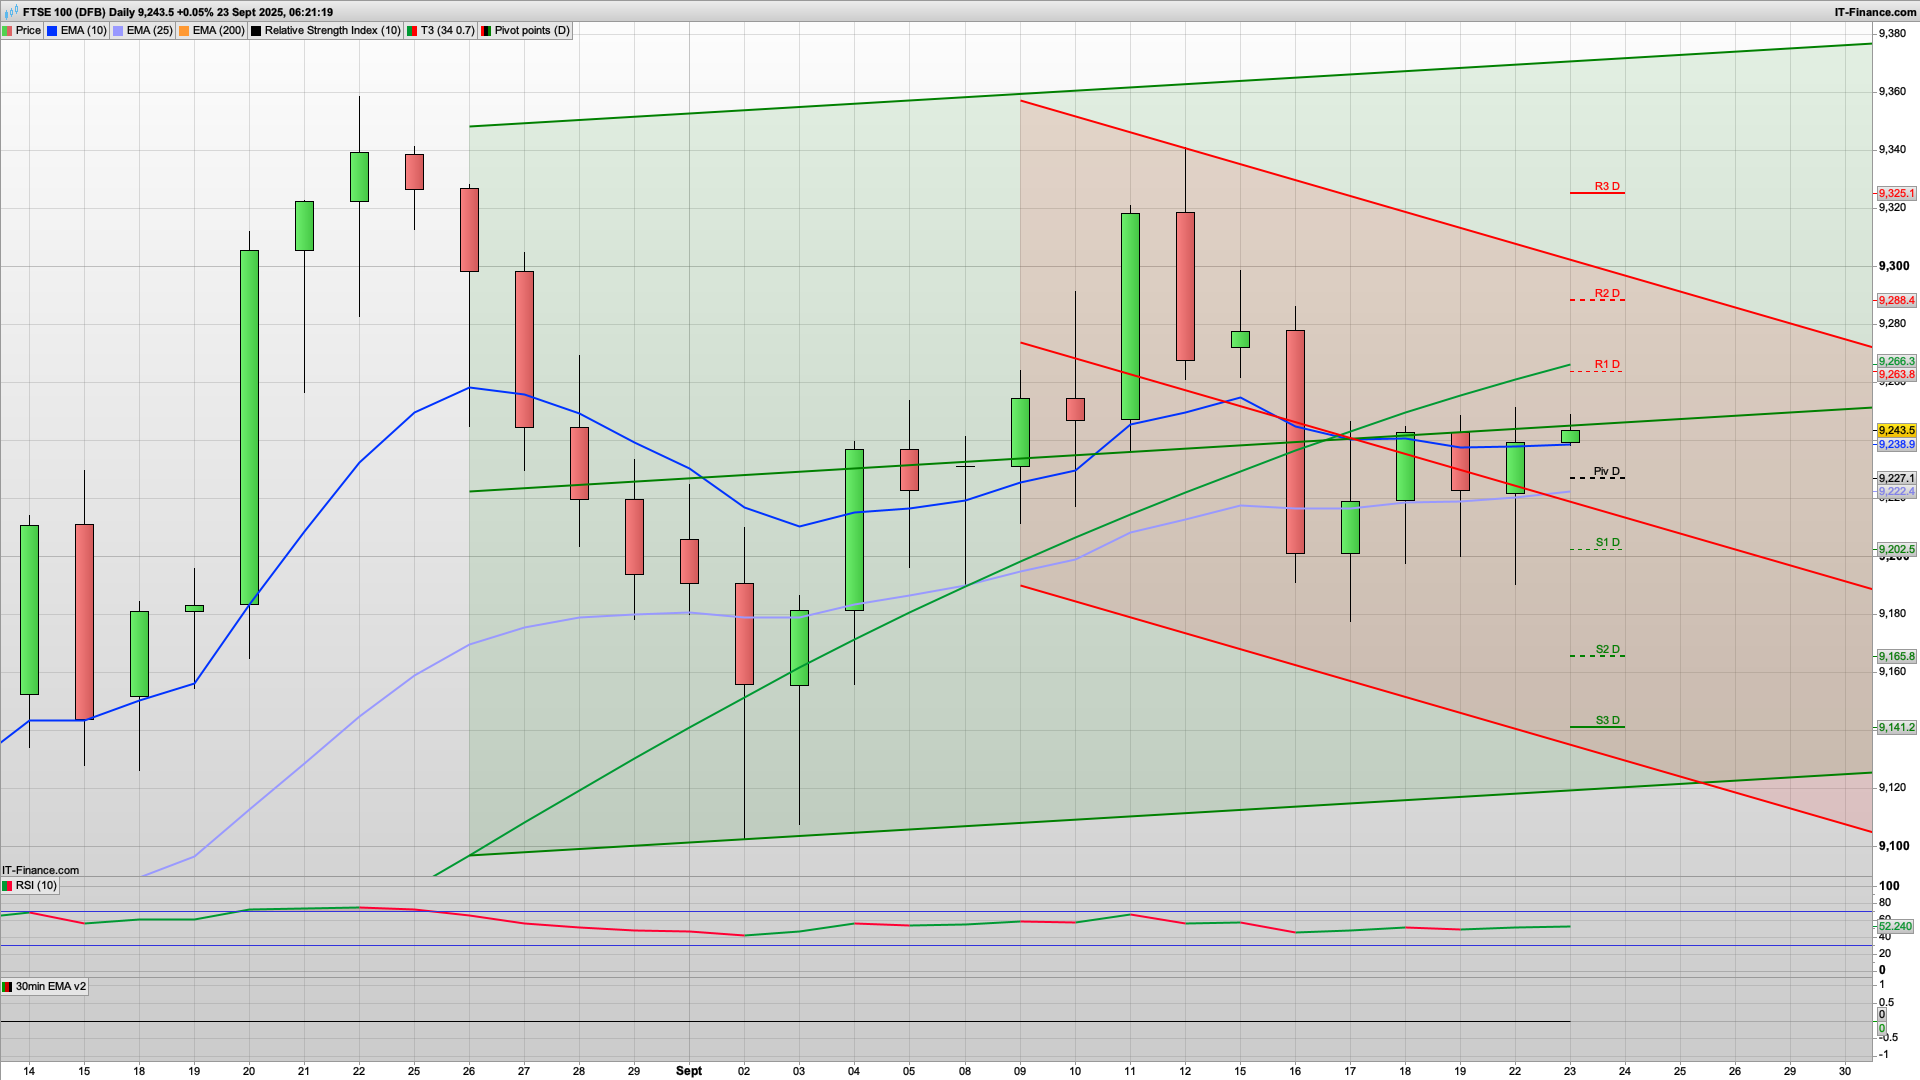
I have held a portion of the long from 9199 yesterday overnight and will just continue to trail the stop on that. For today the bulls will be looking to maintain the upper hand and keep the momentum going and we may well be on for a test of the 9263 R1 and daily resistance level initially. If the bulls can break above this then the 9290 is next up where we have the key fib and the R2 level for today. A bearish reaction at both of these levels is likely so worth taking a short at both, and also some profit off any longs.
This week has continued the "buy the dip" play from last week and we may well see a rise and dip today as a bear Tuesday kicks in later. Initial support is at the 9230 level where we have the 200ema on the 30m, along with the green coral trend line here, and that's just above the daily pivot of 9227. As such I would like to see this hold, at least on the first test to set up some rises towards those resistance levels.
Below the daily pivot then 9202 is S1 for today and then yesterday's low at 9190 below that. If the bears were to really go for it though then continue to keep an eye out for the 9165 area where we have the lower daily support and also S2. 9170 is also the key fib.
I am more inclined to go with the bulls defending the 9230 area initially, and a concerted effort to hold 9200 if seen. That's helped by the 2h coral which is now green and has 9220 as support, along with another test of the bullish Hull MA here.
We have various PMIs out this morning at 0930 as well which may well have a bearing on the direction this morning, with US PMIs out at 1445 later on.
The DAX40 Is also trying to break upwards to start with and looks to be on track for a test of the R1 and key fib at the 23705 area, and as we have the round number here then a dip from here to test the daily pivot support air 23562 would fit the chart well. If the bulls break above then hop on a long for a test of R2 at 23832. I would like to see any test of the daily pivot hold though as we also have the green 30m coral at 23540. A break of this though and then look for a slide to 23381 to test the key fib support.
For the S&P500 it looks like a similar pattern may play out, with the daily pivot support at 6677. A break of this and then look for S1 6654. On the upside, the bulls will be trying to break above the 6700 level which should then see R1 at 6717 above that, and the key fib at 6723. Higher up than 6739 is R2 and the higher level that would be worth a short.
Good luck today.
Interested in how to start trading the FTSE 100? Frequently Asked Questions on Spread betting
Recommended Broker for trading - MT4/5, web and mobile

IC Markets - offers market leading pricing and trading conditions by providing clients with True ECN Connectivity; this allows you to trade on institutional grade liquidity from the world’s leading investment banks, hedge funds and dark pool liquidity execution venues. Highly recommended!
Membership, Trading Tips, Support and Resistance Levels with Live Trading
If you would like more detailed analysis for FTSE 100, DAX40, Gold and the S&P500, including the trades that I am looking to take myself, then please join my active members community.
Keep up to date with new website posts, free sign up below
