
Technical analysis for 27th August 2026
Nvidia beat expectations and guided third-quarter revenue to around $108 billion, comfortably ahead of the roughly $104.2 billion analysts had expected. More importantly, management expects revenue to grow by roughly 70% in fiscal 2028, reinforcing the argument that the AI infrastructure boom still has considerable room to run. Nvidia shares initially dipped after the announcement before turning higher.
Asian equities have responded positively this morning, particularly technology and hardware shares. However, there is an important counterweight: yesterday's US inflation data was hotter than expected, pushing Treasury yields and the dollar higher and increasing speculation that the Federal Reserve could raise rates again.
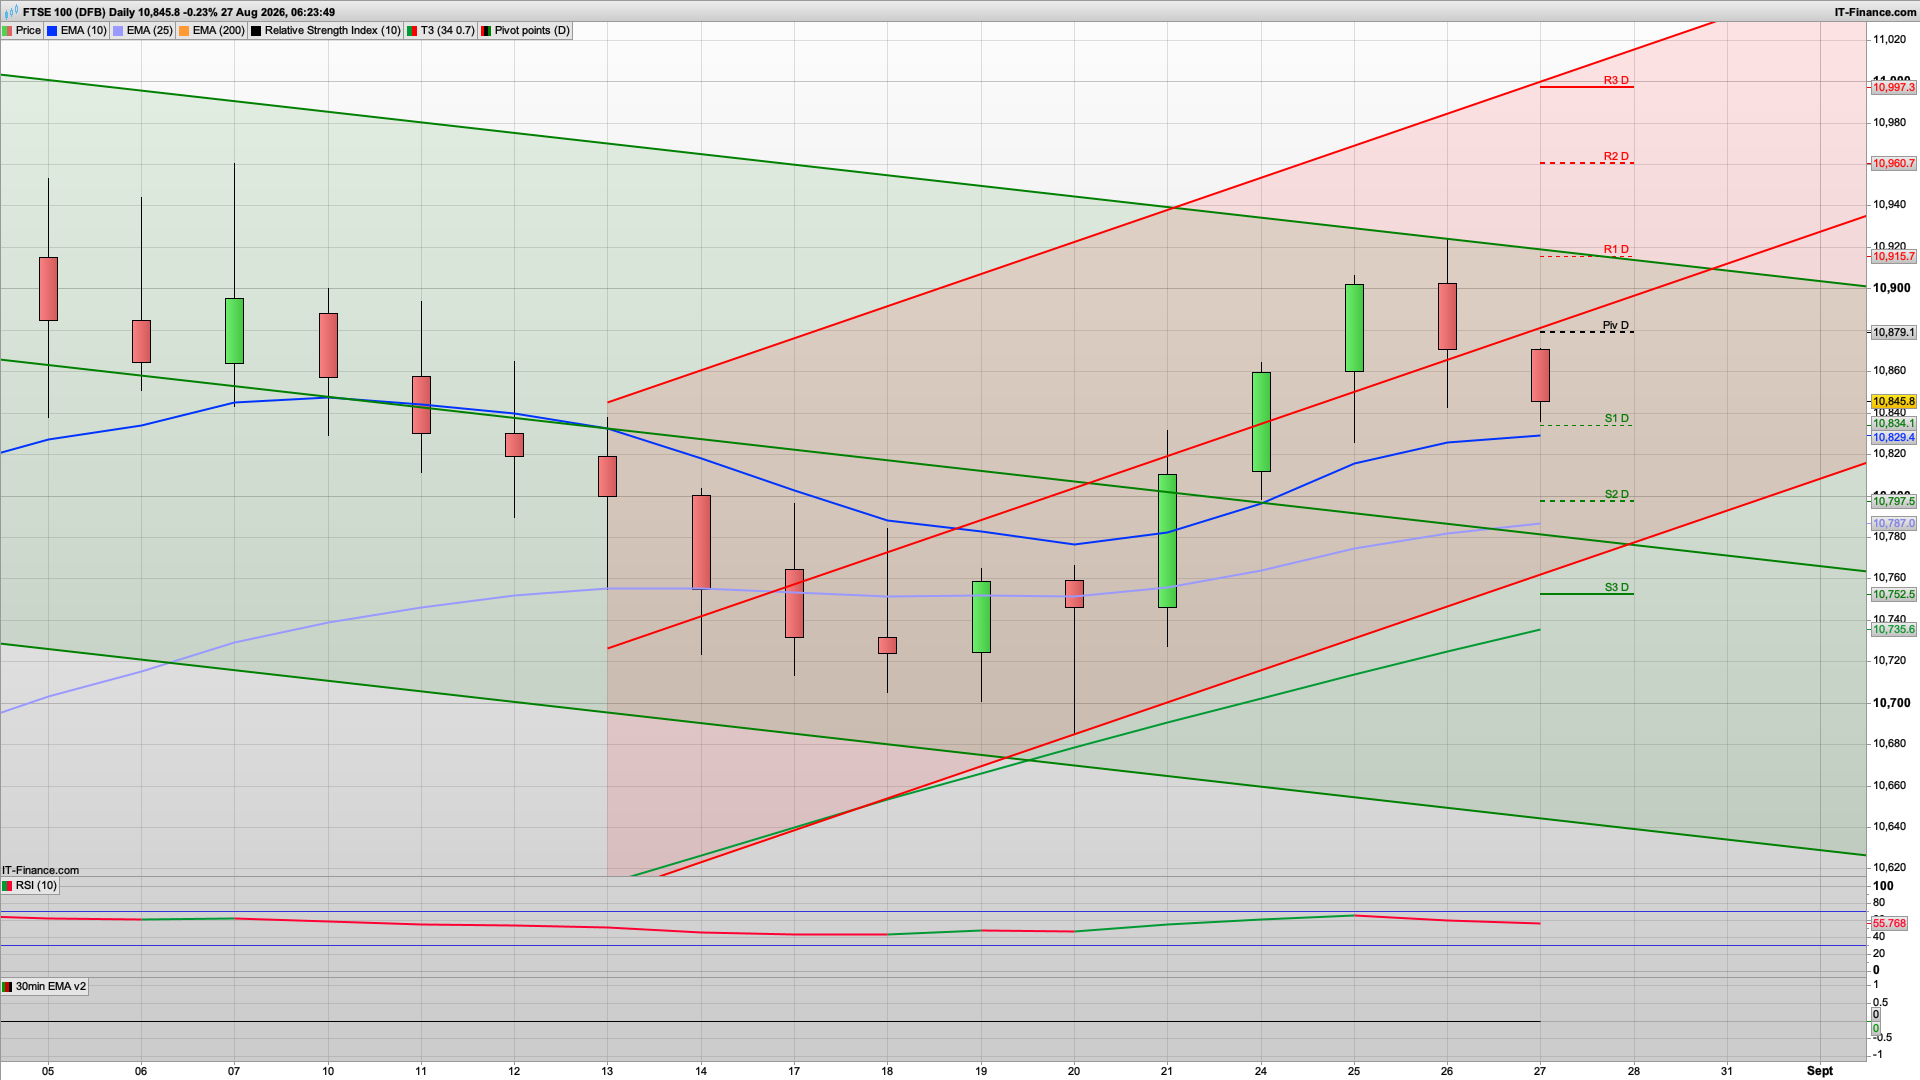
The FTSE100 has ended its 6 day bullish streak as the price of oil dropping weighs it down, along with some profit taking. The 10825 support area will likely be tested today and it will be interesting to see if that holds again, as the bulls failed to break above the 10920 level yesterday. The move above 10904 does bode well though and for further upside they just need the second attempt to stick. Initially we have S1 and that daily support around the 10830 area again so if that holds first thing then a rise and dip may well play out, with another test of the 10905 area.
The Nvidia results may well help underpin some bullishness today though of course the worry is how long can such results continue....
The FTSE100 2h chart has now gone bearish with the recent drops, and has Hull MA resistance at 10908 which looks like it will be another decent short at that level - and utilising the 10904 daily level again too. Generally we may well be seeing some consolidation as we head into the end of the August trading period and all set for a bullish September.
FTSE 100
Bias: Bullish / Neutral short term
The FTSE finally paused yesterday after six consecutive winning sessions. Healthcare and energy shares weighed on the index as falling crude reduced some of the support from the heavyweight oil majors. I don't see one weaker session as enough to reverse the bullish structure. But after the run from below 10,800 towards 10,900, some consolidation is perfectly reasonable.
- Key Levels
- The most important zone remains 10,825–10,850
- As long as the FTSE remains above it, I'm inclined to view weakness as a pullback within the recovery rather than the beginning of another significant decline.
- Above that, I'm watching:
- 10,908 then 10,950 and ultimately 11,000
- Trading Plan
- My ideal sequence is:
- Pullback → 10,830 area → buyers return → LONG
- Alternatively:
- Break 10,900 → successful retest → LONG
- If 10,825 fails convincingly, I'd downgrade the bullish view and reassess.
For more more analysis including other markets please join...
Interested in how to start trading the FTSE 100? Frequently Asked Questions on Spread betting
Recommended Broker for trading - MT4/5, web and mobile

IC - offers market leading pricing and trading conditions by providing clients with True ECN Connectivity; this allows you to trade on institutional grade liquidity from the world’s leading investment banks, hedge funds and dark pool liquidity execution venues. Highly recommended!
Join my Membership for Trading Tips, Support and Resistance Levels with Live Trading
If you would like more detailed analysis for FTSE 100, DAX40, Gold and the S&P500, including the trades that I am looking to take myself, then please join my active members community.
Keep up to date with new website posts, free sign up below