
Technical analysis for 1st June 2026
Based on today's daily charts, the overall picture remains bullish for equities, but the FTSE100 is still the laggard and Gold is attempting a recovery rather than trending strongly.
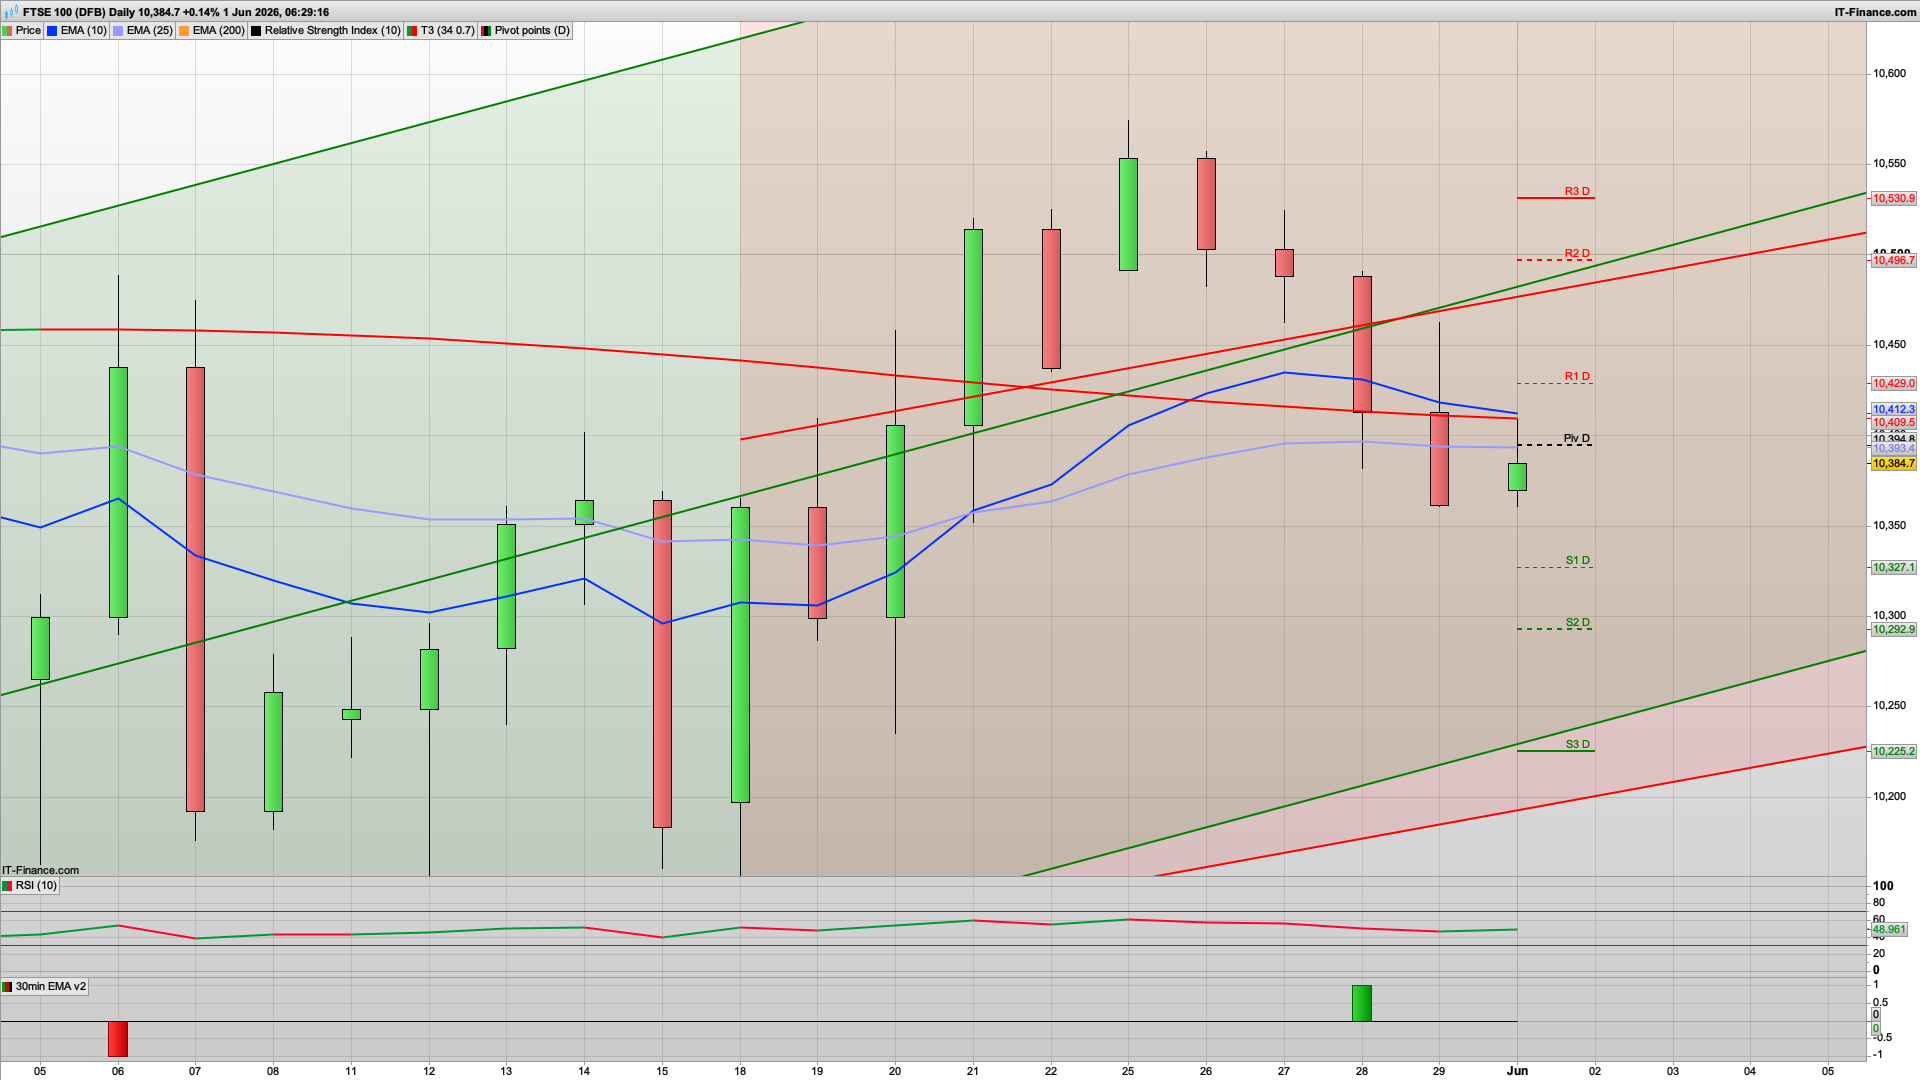
FTSE 100
- Bias: Neutral / Slightly Bullish
- Why
- Price remains below the recent swing highs.
- Trading around the EMA cluster and pivot.
- Momentum weaker than DAX and US indices.
- Market is consolidating rather than trending.
- Why
- Key Levels
- Support: 10,394 → 10,327
- Resistance: 10,429 → 10,497 → 10,530
- Trade View
- Range trade until breakout.
- Bullish only if 10,430–10,500 is reclaimed convincingly.
DAX40
- Bias: Bullish
- Why
- Price remains above the rising 25 EMA.
- Holding above the daily pivot (~25,089).
- Friday's recovery candle defended trend support.
- RSI remains constructive around 60.
- Why
- Key Levels
- Support: 25,089 → 24,975
- Resistance: 25,154 → 25,270 → 25,333
- Trade View
- Preferred: Buy dips above 25,090.
- Bullish target zone: 25,270–25,330
- Invalidation: Daily weakness below 24,975.
Nasdaq 100
- Bias: Strong Bullish
- Why
- Trend remains exceptionally clean.
- Price sitting near channel highs.
- Strong sequence of higher highs and higher lows.
- Above all major moving averages.
- Why
- Key Levels
- Support: 30,327 → 30,182
- Resistance: 30,469 → 30,614 → 30,756
- Trade View
- Preferred: Buy pullbacks.
- If R1 (30,469) breaks decisively, a push toward 30,615–30,750 looks likely.
S&P 500
- Bias: Bullish
- Why
- Strong upward channel intact.
- New highs continue to be accepted.
- Price trading above pivot and rising EMA.
- Momentum still supportive.
- Why
- Key Levels
- Support: 7,580 → 7,562
- Resistance: 7,595 → 7,612 → 7,628
- Trade View
- Preferred long while above 7,580.
- Potential extension toward 7,630+.
Gold
- Bias: Neutral with Bullish Recovery Potential
- Why
- Still below major falling trend resistance.
- However, buyers have recovered from the recent lows.
- Trading near the pivot and 25 EMA.
- Not yet a confirmed bullish reversal.
- Why
- Key Levels
- Support: 4,486 → 4,434
- Resistance: 4,593 → 4,647 → 4,699
- Trade View
- Above 4,540–4,590, recovery can continue.
- Below 4,486, sellers regain control.
Best Trading Opportunities Today
- Nasdaq Long
- Buy pullbacks toward 30,330–30,400
- Target 30,615 → 30,750
- S&P Long
- Buy above 7,580
- Target 7,630+
- DAX Long
- Buy above pivot 25,089
- Target 25,270 → 25,330
The strongest daily trend remains the Nasdaq, followed closely by the S&P 500. DAX40 remains constructive, while FTSE is still lagging and Gold is transitioning from bearish to neutral rather than outright bullish.
Start of the month so a possible bull Monday with new month money, however the backdrop for the FTSE100 remains weaker, with the bulls needing to break above the 10430 area where we have R1 and the 30m 200ema. The 2h chart is also bearish with Hull MA resistance at 10420 so this area looks quite key to start with. If the bulls do manage to push above that then we can look for a test of the 10492 daily resistance level and a short here is worth taking.
The daily chart has also weakened with the price now below the 25ema so the ball is firmly in the bulls court to try and get things bullish again. The bears will be aiming for a drop down to the 10330 area and a test of S1 and the key fib, and ideally this will hold any early test this morning, with a potential rise later as the US comes online.
We have a decent gap close opportunity on the S&P500 at 7576 and with the daily pivot just above at 7579 this a dip and rise playing out so a long at this area looks like the preferred play today.
The market will generally be looking to continue May's bullishness and continue pushing on, however the Middle East is still not resolved with just a trickle of ships moving through the Straits at the moment, and further "defensive" attacks by the US on Iranian targets.
Generally though the Raff channels are all still heading up once you zoom out to the daily timeframes, and whilst we are just in the middle of the channels on all the markets I comment on, buying the dips is still the longer term preferred play.
Interested in how to start trading the FTSE 100? Frequently Asked Questions on Spread betting
Recommended Broker for trading - MT4/5, web and mobile

IC Markets - offers market leading pricing and trading conditions by providing clients with True ECN Connectivity; this allows you to trade on institutional grade liquidity from the world’s leading investment banks, hedge funds and dark pool liquidity execution venues. Highly recommended!
Join my Membership for Trading Tips, Support and Resistance Levels with Live Trading
If you would like more detailed analysis for FTSE 100, DAX40, Gold and the S&P500, including the trades that I am looking to take myself, then please join my active members community.
Keep up to date with new website posts, free sign up below
