
Technical analysis for 5th March 2026
FTSE 100 — Bearish correction
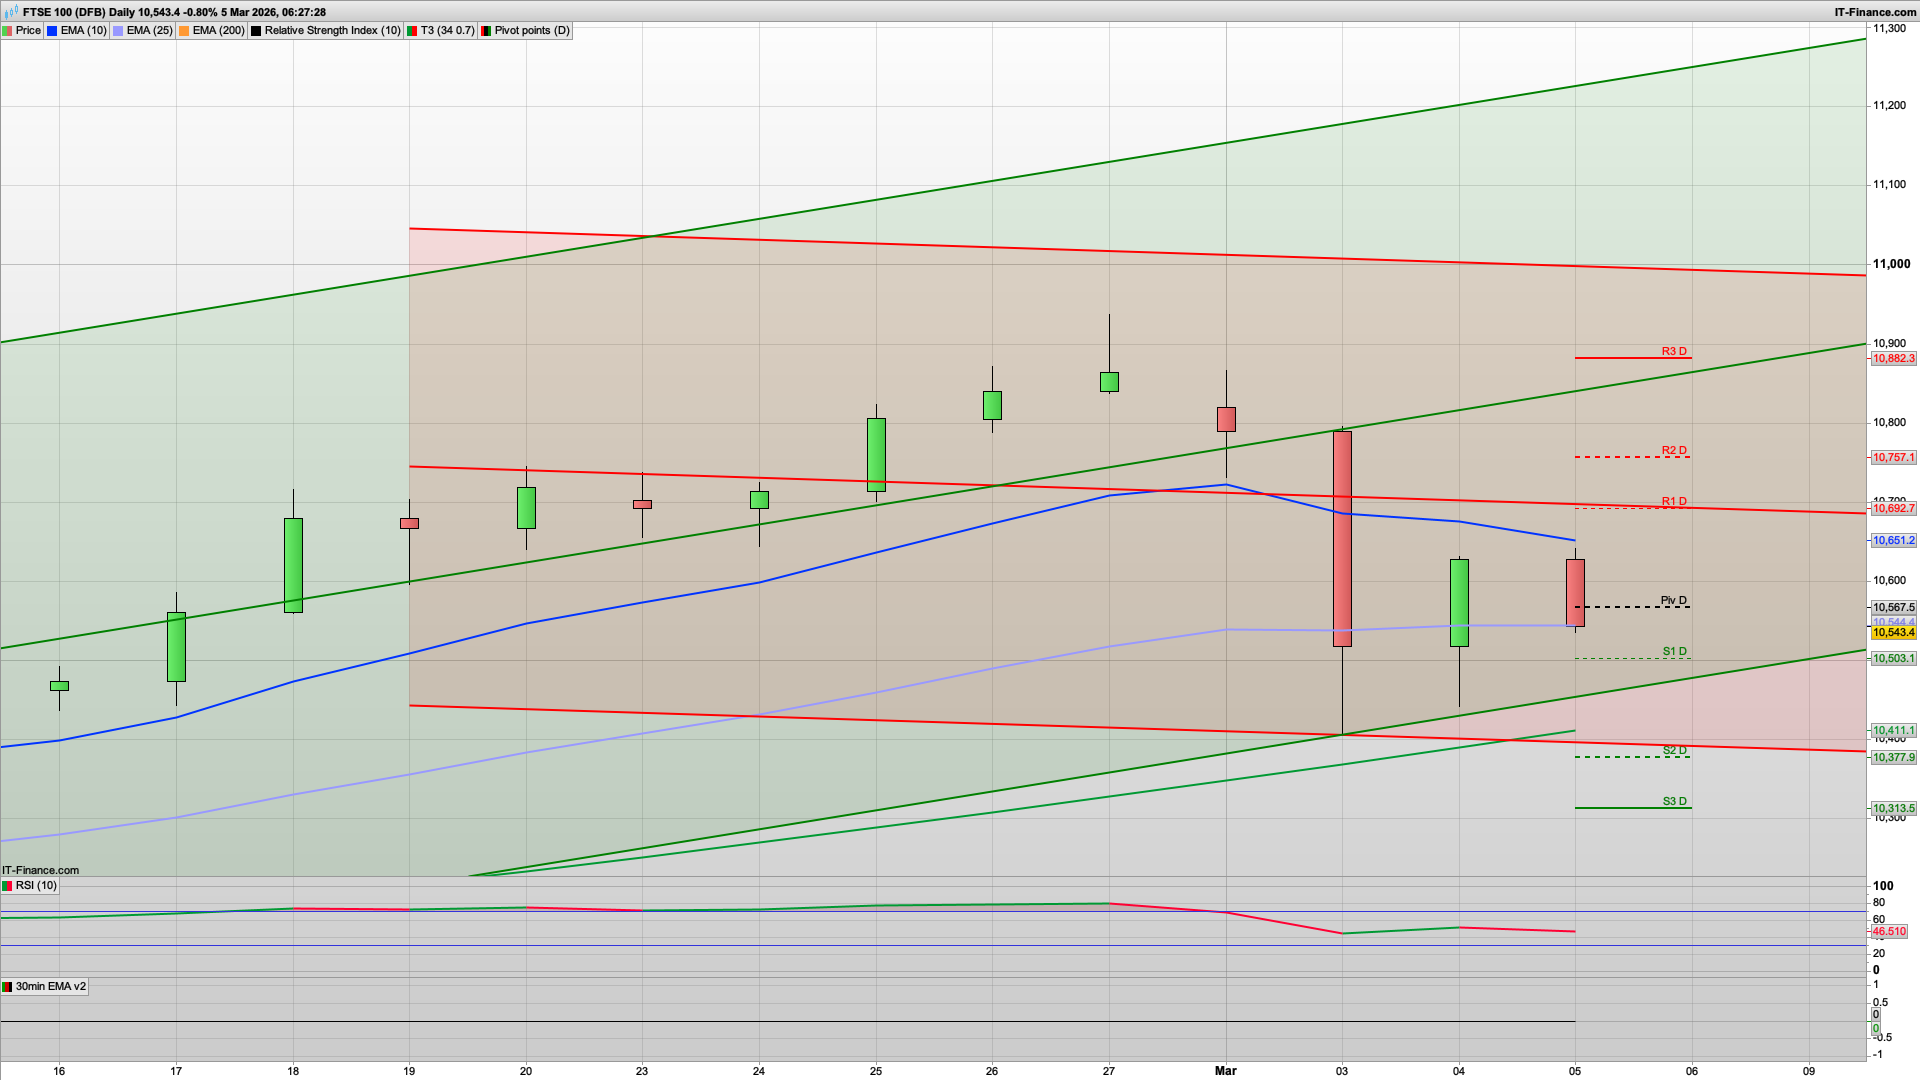
- Structure
- Broke the rising channel
- Large impulsive sell candle earlier this week
- Price now below EMA trend support
- Trading around pivot/S1
- Momentum shifted bearish short-term.
- Bias: Sell rallies
DAX — Bearish continuation
- Structure
- Clear lower highs + lower lows
- Price holding below pivot
- Below the EMA stack
- Still inside descending channel
- Yesterday’s small bounce failed and sellers remained in control.
- Bias: Sell rallies
- Next downside magnet = S1 → S2 zone.
S&P 500 — Bearish but attempting bounce
- Structure
- Still inside down channel
- EMAs pointing down
- Price hovering around pivot
- Yesterday produced a bounce candle, but structure has not flipped yet.
- Bias: Sell rallies unless pivot reclaim holds
- If price holds above pivot → range day possible.
GOLD — Bullish trend but correcting
- Structure
- Uptrend channel still intact
- Pullback toward pivot / EMA support
- No structural lower low
- Trend remains intact despite correction.
- Bias: Buy pullbacks
A decent bounce yesterday that will give hope to the bulls and they will be looking to build on today. There is initial support from the Hull MA on the 2h this morning at 10555 but we may well see a fear driven drop down to the stronger support at the 10500 level - we have S1, key fib and round number all here. If that holds then we may well see the bulls try and drive it up and cement in a higher low for the week so far - so far we have had 10400 Tuesday, 10450 Wednesday..... 10500 today for a nice neat pattern?!
It's always tricky to sort the facts from what you hear on the news, but whilst the attacks are still ongoing, it "sounds" like Iran may well be on the ropes more so currently, but the power vacuum will be the next main hurdle - the stated aim being regime change but we aren't hearing much about any uprisings..... maybe the plan is to flatten it and then see how the dust settles.....?!
Anyway, back to the levels, if the 10500 holds then a rise towards the 10650 2h red coral line may well play out, if the bulls can break above the 10565 daily pivot. Again, there are a cluster of resistance levels at the 10650 with the 30m 200ema and key fib also here.
Above this then 10692 is R1 and the next likely target though that may be a bit optimistic for today. The 20d Raff channel remains heading upwards and the FTSE100 is still remaining surprisingly resilient - considering we were at 9700 not that long ago! The S&P500 is also trying to push higher - the daily candles have quite long tails showing decent buying pressure - the "buy the dip" crowd alive and well still.
It's also looking like a possible dip and rise for the DAX40 and S&P500 today and I am looking at 23960 and 6800 as the main support levels on them for today.
Good luck.
Interested in how to start trading the FTSE 100? Frequently Asked Questions on Spread betting
Recommended Broker for trading - MT4/5, web and mobile

IC Markets - offers market leading pricing and trading conditions by providing clients with True ECN Connectivity; this allows you to trade on institutional grade liquidity from the world’s leading investment banks, hedge funds and dark pool liquidity execution venues. Highly recommended!
Join my Membership for Trading Tips, Support and Resistance Levels with Live Trading
If you would like more detailed analysis for FTSE 100, DAX40, Gold and the S&P500, including the trades that I am looking to take myself, then please join my active members community.
Keep up to date with new website posts, free sign up below
