
Technical analysis for 11th June 2026
The overall picture remains risk-off, but there are signs that the selling is becoming stretched. DAX and FTSE are sitting near support areas where a short-covering bounce is possible, while Nasdaq and S&P remain technically bearish. Gold is still the weakest chart.
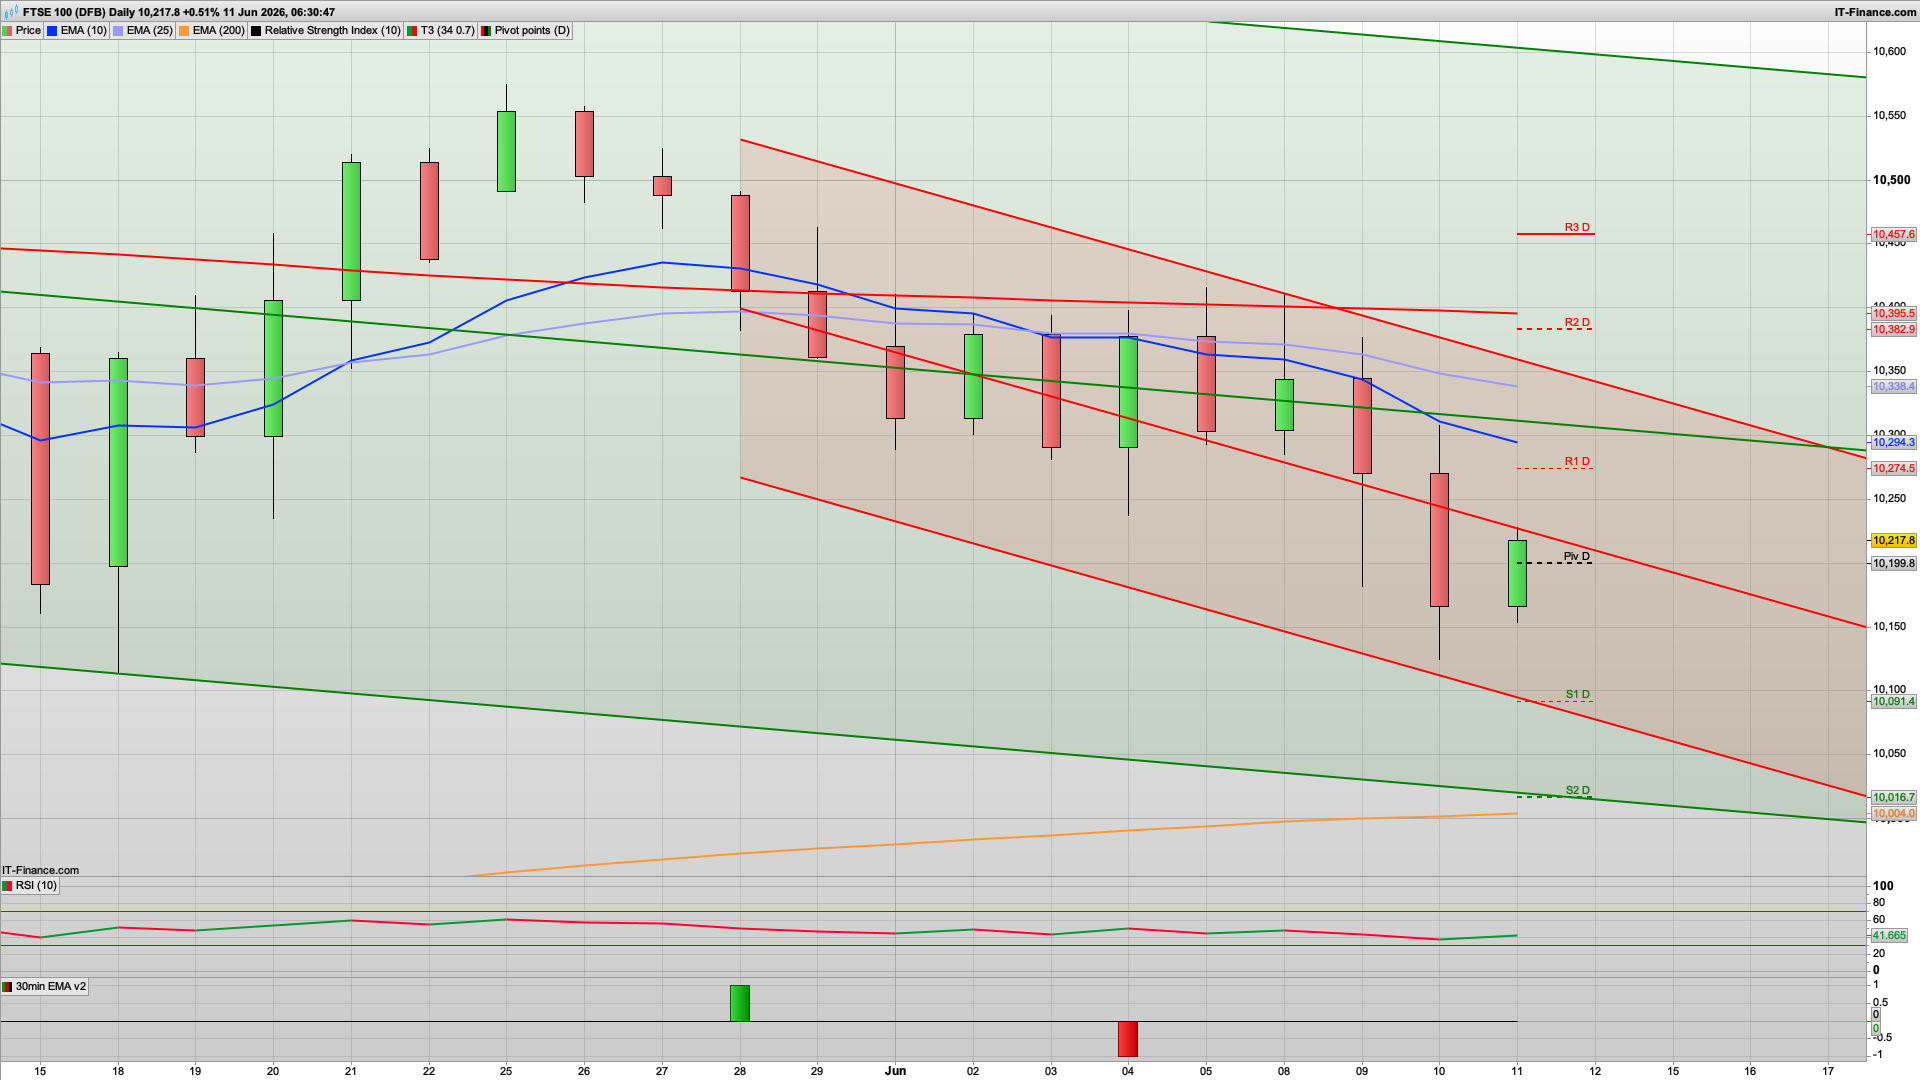
FTSE 100
- Bias: Bearish
- Structure
- Still inside descending channel.
- Trading below EMA25 and EMA200.
- Relative strength remains weak.
- Yesterday's green candle looks more like a relief bounce than a trend reversal.
- Structure
- Key Levels
- Resistance: 10,275 → 10,382
- Support: 10,091 → 10,017 → 10,000
- Trading View
- Prefer selling strength below 10,300.
- A break under 10,090 would expose 10,000.
- Expected path: 10,090 then 10,000
DAX 40
- Bias: Bearish (with bounce potential)
- Structure
- Still trading within a falling channel.
- Price below EMA25 (24,553).
- Below EMA200 (24,503).
- RSI around 39, showing weak momentum.
- Structure
- Key Levels
- Resistance: 24,356 → 24,730
- Support: 23,794 → 23,606
- Trading View
- Sell rallies into 24,300–24,450.
- A break below 24,000 would likely accelerate selling.
- Need a close above 24,550 to neutralize the bearish bias.
- Expected path: 24,000–23,800 zone
Nasdaq 100
- Bias: Bearish
- Structure
- Lower highs and lower lows remain intact.
- Price below EMA25 (29,317).
- Trading beneath pivot (28,715).
- Strong rejection from the recovery attempt.
- Structure
- Key Levels
- Resistance: 29,202 → 29,701
- Support: 28,592 → 28,216 → 27,729
- Trading View
- Prefer selling rallies while below 29,200.
- Market remains vulnerable to another leg lower.
- Expected path: 28,600 then 28,200
S&P 500
- Bias: Bearish
- Structure
- Trading below EMA25.
- Below pivot (7,306).
- Trend channel remains downward.
- Recovery attempts continue to fail.
- Structure
- Key Levels
- Resistance: 7,388 → 7,479
- Support: 7,214 → 7,132
- Trading View
- Any rally into 7,380–7,450 is likely to meet sellers.
- Bears remain in control below 7,450.
- Expected path: 7,214 support test
Gold
- Bias: Strong Bearish
- Structure
- Steep descending channel.
- Below EMA25 and EMA200.
- Massive bearish impulse candle followed by only a weak bounce.
- Trend remains firmly down.
- Structure
- Key Levels
- Resistance: 4,184 → 4,321
- Support: 3,973 → 3,899
- Trading View
- Continue looking for short opportunities on rallies.
- Bulls need a close above 4,180–4,200 to improve the outlook.
- Expected path: 3,970 area
Best Setups Today
- Gold Short
- Still the cleanest trend.
- Nasdaq Short on Rally
- Sell 29,000–29,200 resistance area.
- DAX Short if Bounce Fails
- Watch 24,350–24,550 for rejection.
The key question today is whether the indices can stage a short-covering bounce after several days of declines. Until they reclaim their 25-day EMAs and pivots, rallies are still more likely to be selling opportunities than the start of a new uptrend.
Interested in how to start trading the FTSE 100? Frequently Asked Questions on Spread betting
Recommended Broker for trading - MT4/5, web and mobile

IC Markets - offers market leading pricing and trading conditions by providing clients with True ECN Connectivity; this allows you to trade on institutional grade liquidity from the world’s leading investment banks, hedge funds and dark pool liquidity execution venues. Highly recommended!
Join my Membership for Trading Tips, Support and Resistance Levels with Live Trading
If you would like more detailed analysis for FTSE 100, DAX40, Gold and the S&P500, including the trades that I am looking to take myself, then please join my active members community.
Keep up to date with new website posts, free sign up below
