
Technical analysis for 20th April 2026
FTSE 100
- Bias: Neutral / Range
- Mixed structure again
- Recent bullish push → immediate rejection
- Sitting around pivot with no direction
- Plan
- Sell highs (~10,700+)
- Buy lows (~10,600 area)
- Sell highs (~10,700+)
- Avoid middle
- Expect range conditions
DAX40
- Bias: Neutral → Slight Bearish
- Strong bullish impulse (17th) now followed by bearish pullback candle
- Price rejecting around trendline / pivot zone
- Losing short-term momentum
- Plan
- Sell below ~24,400–24,500 (pivot area)
- Only buy if reclaim + hold above prior high
- Expect pullback / consolidation after strong move
NASDAQ
- Bias: Bullish (buy-the-dip)
- Strong uptrend intact
- Current candle = healthy pullback after expansion
- Holding well within channel
- Plan
- Buy dips into S1 (~26,400)
- Channel support
- Target continuation toward highs
- Expect dip → continuation
S&P 500
- Bias: Bullish (but cooling slightly)
- Similar to NASDAQ:
- Strong move → now minor pullback
- Still above structure + pivot
- Plan
- Buy dips toward ~7,050–7,100
- Slower pace vs NASDAQ
- Expect grind higher after pullback
GOLD
- Bias: Neutral (choppy)
- No clean trend:
- Alternating candles
- Mid-channel positioning
- Holding pivot but no momentum
- No clean trend:
- Plan
- Sell into 4,880–4,920 resistance
- Buy deeper support (~4,700–4,750)
- Avoid chasing
- Expect two-way / mean reversion
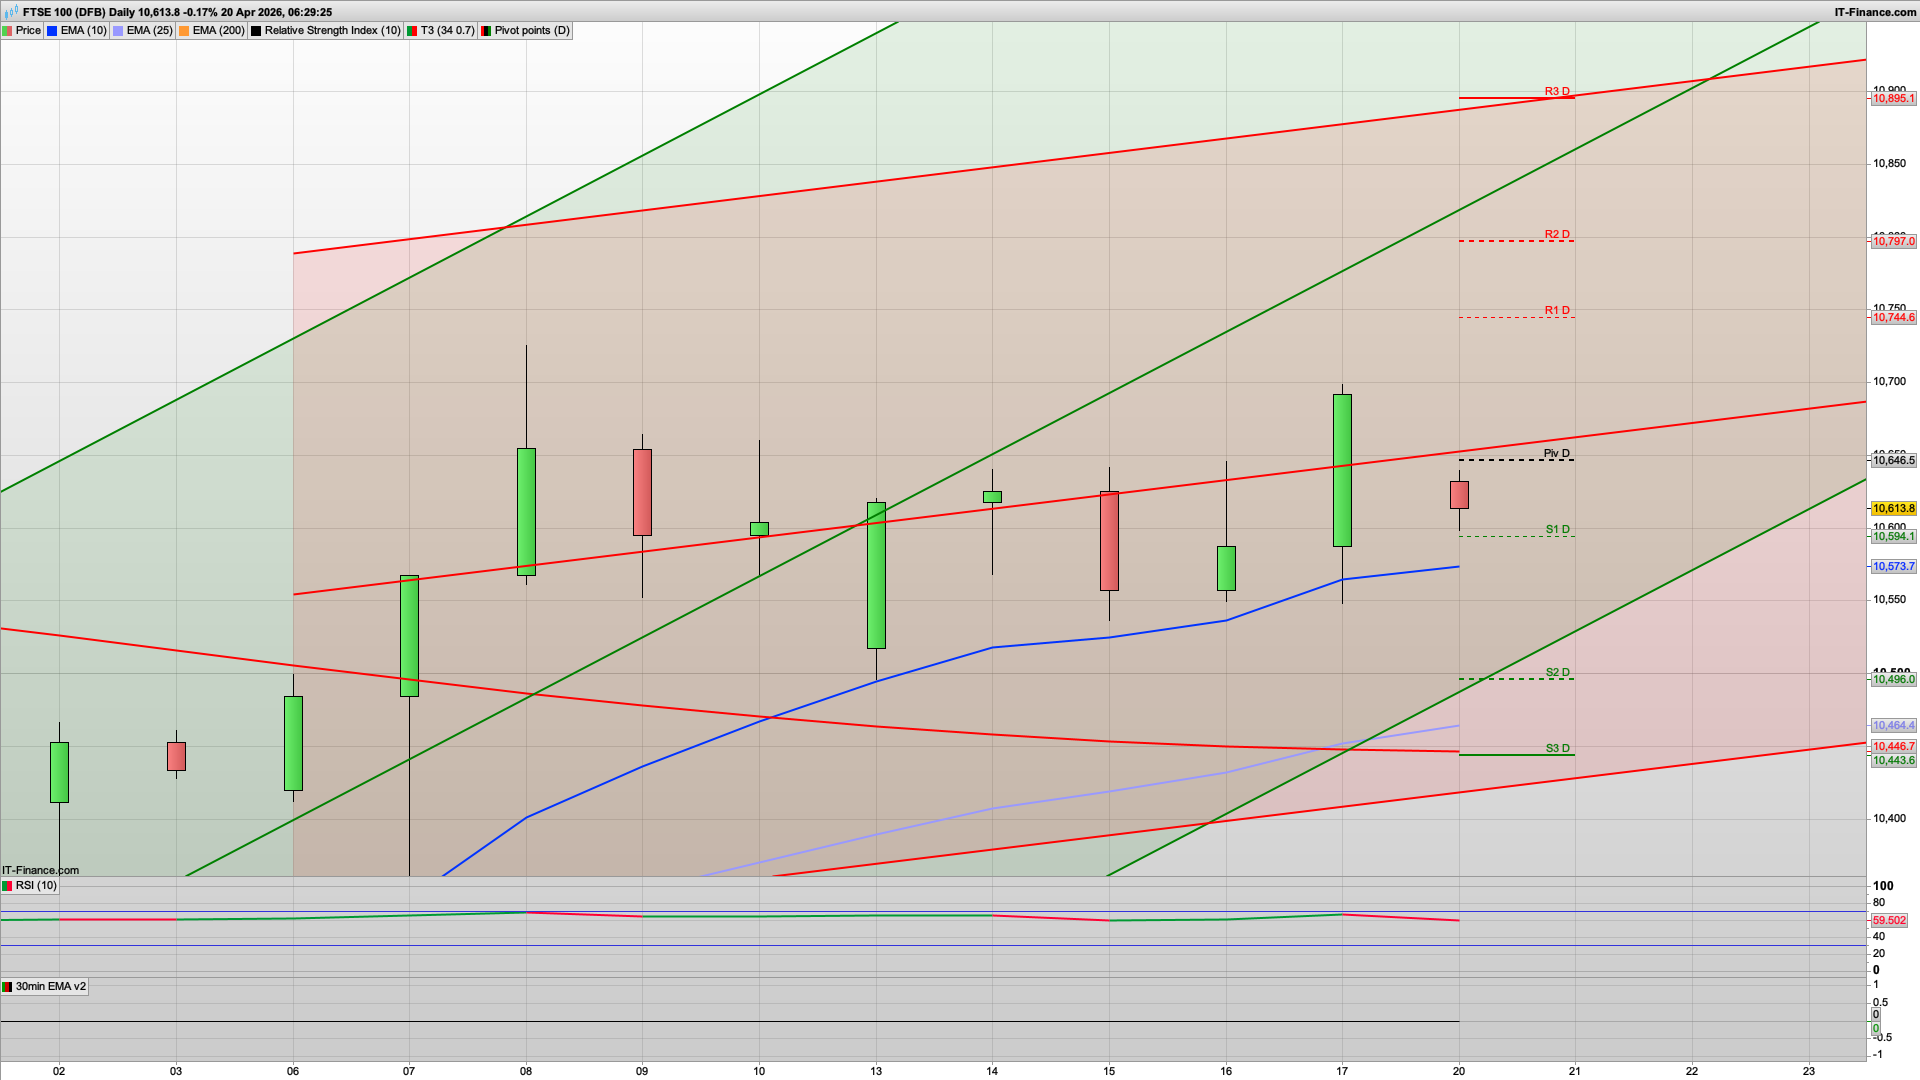
Another Monday and another gap down to start with - will the usual pattern of the gap close and a bull Monday play out? Initially we have decent looking support at the 10590 area with both S1 and the 30m 200ema here, along with the green 2h coral. As such it would be good to see this hold for the bulls to push up towards the 10700 area and a test of the key fib at 10712.
Below 10590 then 10560 is the key fib and next support prior to S2 at 10496. The bulls will of course be looking to try and keep Fridays bullish momentum going so I am inclined to go with the 10590 area holding this morning.
On the upside, then the daily pivot at 10646 is first up then the gap at 10692. With the key fib at 10712 then I expect any early rise to stall in this area but if the US bulls also fight back then we could see a break high later on.
If that plays out then 10744 R1 is next up, with an outside chance of the R2 at 10797 being tested - that may be a bit optimistic for today though but you never know!
If we do see that area, and bear in mind there is also daily resistance at the 10792 level, then a rise may well falter here.
The 2h chart is also bullish still and the bulls will be keen to keep that the case, with the 10600 coral and Hull MA both looking bullish. The daily chart is also bullish given the recent strength and rises, and the 10465 level is now the current 25ema support level. The 20d Raff is also still heading upwards and a rise into the "sell in May" would fit well.
So generally thinking a rise and dip later likely today across the board as the bulls fight back from the gap down.
Good luck today.
Interested in how to start trading the FTSE 100? Frequently Asked Questions on Spread betting
Recommended Broker for trading - MT4/5, web and mobile

IC Markets - offers market leading pricing and trading conditions by providing clients with True ECN Connectivity; this allows you to trade on institutional grade liquidity from the world’s leading investment banks, hedge funds and dark pool liquidity execution venues. Highly recommended!
Join my Membership for Trading Tips, Support and Resistance Levels with Live Trading
If you would like more detailed analysis for FTSE 100, DAX40, Gold and the S&P500, including the trades that I am looking to take myself, then please join my active members community.
Keep up to date with new website posts, free sign up below
