
Technical analysis for FTSE 100 for 2nd April 2024
Britain's main stock indexes ended the March quarter on a positive note as data confirmed that Britain's economy entered shallow recession in 2023, while JD Sports had its best day since April 2020 after confirming earnings guidance.
The bluechip FTSE 100 rose 0.3% and the midcap FTSE 250 index was up 0.4% on the day, hitting over one-year highs earlier in the session, with the benchmark index logging its best month since November 2022.
The resources-heavy index also ended the January-March quarter with around 3% gains, its highest since December 2022 but lagged its European peers.
A gauge of global share markets was barely changed on Thursday as it was poised to end the quarter with solid gains, while a strong dollar kept the yen near its weakest in decades amid the threat of intervention from Japanese authorities.
Wall Street's main stock indexes finished the session with minimal changes as markets broadly were largely rangebound ahead of Friday's much-anticipated U.S. personal consumption expenditures (PCE) price index data, a closely watched inflation measure. Few markets will be open to assess and respond to the fresh data, however, given the long Easter weekend in many countries.
Asia
Asian stocks rose on Tuesday and the dollar firmed, keeping the yen pinned near the 152-per-dollar levels that has traders worried about possible intervention, as expectations that the Federal Reserve was close to cutting interest rates faded.
Data on Monday showed U.S. manufacturing grew for the first time in 1-1/2 years in March as production rebounded sharply and new orders increased, highlighting the strength of the economy and casting doubts on the timing of Fed rate cuts.
The robust manufacturing data sent yields on U.S. Treasuries higher, with two-year and 10-year yields climbing to two-week peaks, boosting the dollar.
China stocks logged their biggest daily gain in a month on Monday, after the latest manufacturing activity data signalled that the economy's recovery is gaining traction.
Overnight, S&P 500 kicked off the first session of the second quarter on a quiet note, weighed by worries over the timing of interest rate cuts after stronger-than-expected manufacturing data pushed Treasury yields higher. The index had clocked the biggest first quarter percentage gain in five years.
In commodities, U.S. crude rose 0.3% to $83.96 per barrel and Brent was at $87.72, up 0.34% on the day, aided by signs of improved demand and rising Middle East tensions.
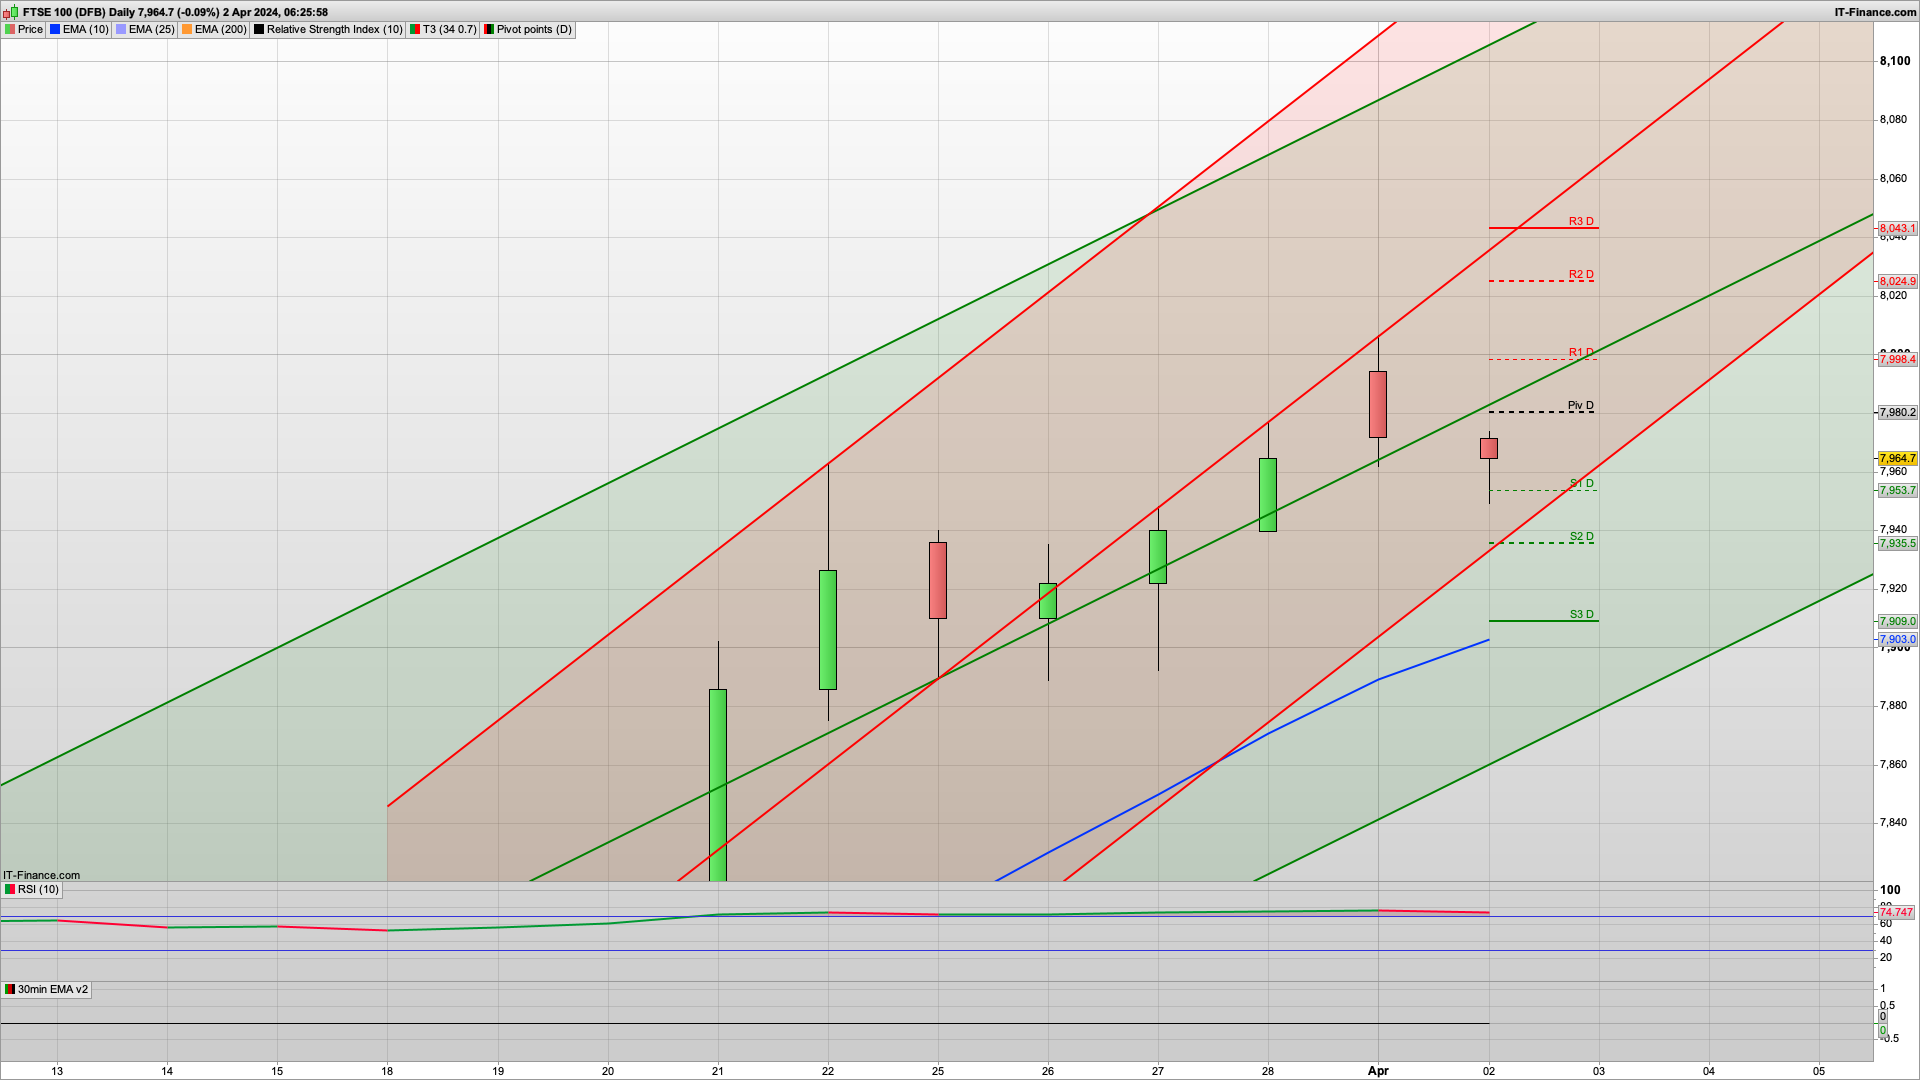
FTSE 100 technical analysis for today, 2nd April 2024
Might see a bit of chop today after the long weekend, however a rise to once again test the 8000 area looks possible, especially as we saw it on the futures yesterday. The 2h chart is bearish to start with though and has Hull MA resistance at 7990 so lending weight to this area as resistance to start with.
We may well see a rise and dip play out today as a bit of bear Tuesday kicks in later, and that would tally with the S&P500 rising to the 5248 area to test its Hull MA resistance. We have initial resistance at the daily pivot and the red 30m coral line as well at the 7983 area to also give a bit of weight to this level.
The general sentiment on the daily charts remains bullish though as the Raff channels continue to head up, with the S&P needing to break above the 5275 level for continued upside.
Above the 8000 level the bulls will be looking to test 8024 where we have R2 and 8029 for the key fib. It will be interesting to see if they manage to take it to that level today but with R1 at 7998 and yesterdays out of hours 8008 level getting a bearish reaction we might not get that high today.
Above that and 8043 is R3 which is more likely to be seen later in the week.
For the bears the 7950 its the main support, and we have S1 and the 30m 200ema here. We also held this level overnight so a double bottom here and a climb from there would make sense from a charting point of view. It will be up to the S&P500 bulls to defend any drops today really.
Good luck today
Interested in how to start trading the FTSE 100? Frequently Asked Questions on Spread betting
Recommended Broker for FTSE 100 trading and how to start trading using support and resistance

IC Markets - offers market leading pricing and trading conditions by providing clients with True ECN Connectivity; this allows you to trade on institutional grade liquidity from the world’s leading investment banks, hedge funds and dark pool liquidity execution venues. Highly recommended!
Membership, Trading Tips, Support and Resistance Levels with Live Trading
If you would like more detailed analysis for FTSE 100, DAX, Gold and S&P, including the trades that I am looking to take myself, then please join my active members community.
What you get
- Daily Analysis pre market open (sent around 7am each day) for FTSE 100, DAX40, Gold and S&P 500.
- Daily email pre market includes my trading plan for the day including ORDER levels, with stops and targets/limits
- Telegram live trading room and group membership for discussion and realtime trade updates
Keep up to date with new content, free sign up below with just your email address
