
Technical analysis for FTSE 100 for 7th May 2024
Britain's FTSE 100 hit a fresh record high on Friday, led by gains in homebuilder stocks, while softer-than-expected U.S. jobs data boosted investor sentiment. The blue-chip FTSE 100 ended the session up 0.5%, after hitting a fresh record high of 8,213.49 points earlier in the day. The FTSE 250 touched its highest levels since February last year and ended 0.6% higher. Both indexes registered a second straight week of gains.
Signs of easing inflation, hopes of early interest rate cuts by the Bank of England and attractive prices have helped boost investor interest in UK equities.
In the U.S., investors reacted favourably to the release of data showing slower-than-expected job growth and a dip in annual wage growth in April, which increased the likelihood that the Federal Reserve would cut interest rates later this year.
Gilts and London stocks were poised to catch up with global gains, following Monday's market holiday. Fed Chair Jerome Powell downplaying the risk of rate hikes and weaker-than-expected U.S. labour data has renewed confidence in rate cuts.
FTSE futures suggest the cash index is heading higher into record territory at the open, following gains in Asia and on Wall Street.
German factory orders are the highlight of the economic calendar, along with European retail sales numbers. UBS reports earnings.
Asia
Asian shares made 15-month highs on Tuesday on renewed confidence of U.S. interest rate cuts, while a weaker yen and a small dip in the Australian dollar kept the dollar steady.
Australia's central bank left interest rates on hold, as expected, but the Aussie dollar slipped about 0.4% and the Australian stock market rose as policymakers did not strengthen guidance around the risk of another rate hike.
In Hong Kong the Hang Seng was set to snap a 10-day winning streak with a 0.9% loss, though markets in Taiwan and South Korea were all higher.
MSCI's broadest index of Asia-Pacific shares outside Japan was up 0.3%. Japan's Nikkei rose 1.3%.
FTSE futures were up 1% pointing to a positive return from a market holiday. European futures rose 0.3% and S&P 500 futures were flat.
The mood was underpinned by last week's softer-than-expected U.S. jobs data and remarks from Federal Reserve Chair Jerome Powell reiterating that the next move in rates will be lower.
In commodity trade, oil was a tad firmer, with Brent crude futures up 0.3% to $83.58 a barrel with a ceasefire deal in the Middle East proving elusive. Gold rose overnight and was steady at $2,325 an ounce on Tuesday.
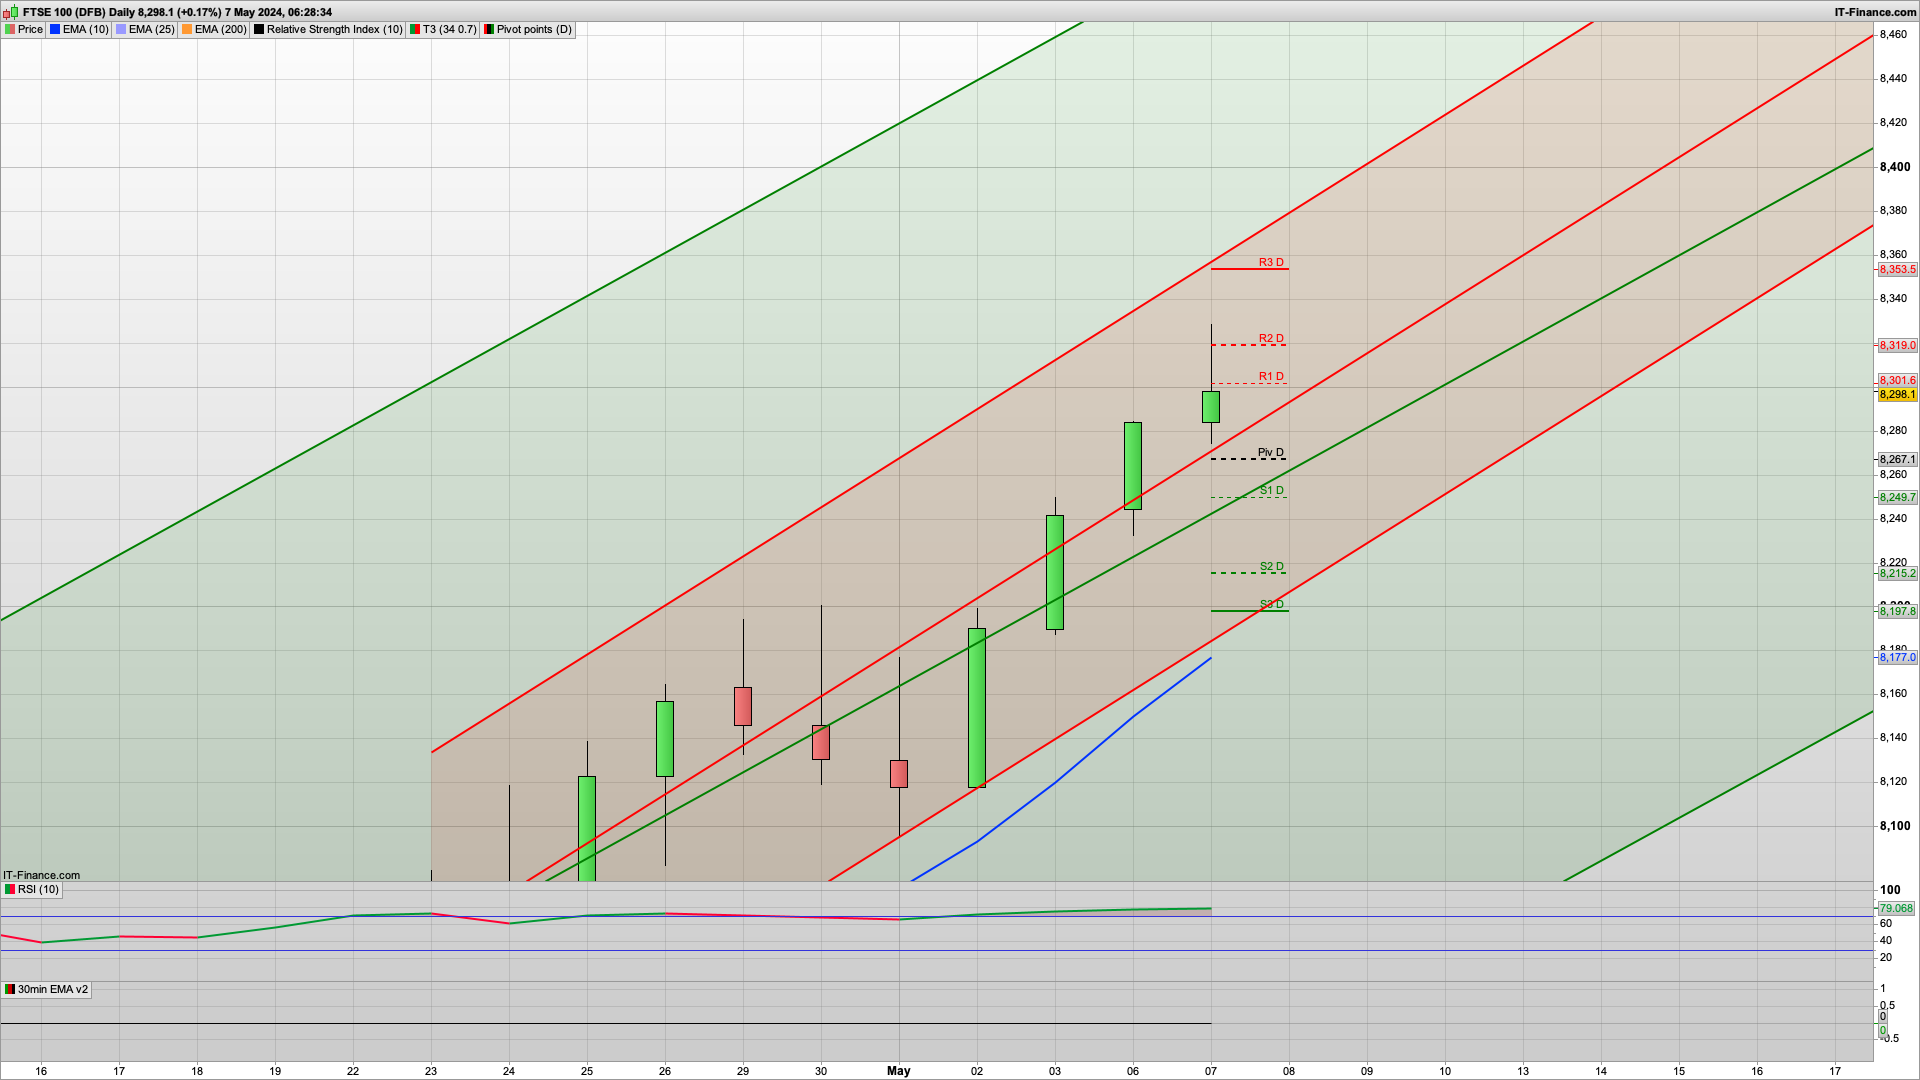
FTSE 100 technical analysis for today, 7th May 2024
Well there's the 8300, albeit out of hours but a push up towards the 8320 level again looks distinctly possible. With a double top, R2 and the key fib resistance all here for today then it would be good to see another reaction here and a drop back down to the support at the 8270 area.
Initial support being 8267 from the daily pivot and 8260 for the 2h Hull MA so should see a reaction if it gets tested and I would like to see this hold. The bulls will certainly be (still!) keen to hold the momentum and keep the rises coming. Slight ramping up in the Middle East with Israel attacking Rafah, after Israel rejected the ceasefire deal. The world will be watching to see how it plays out.
To start the shortened week, the charts continue to look positive as the seasonality once again plays out, though that does infer a bit of a drop in the second half of May - which would make sense for a pullback from record highs.
If the bears break the daily pivot at 8267 then the next key support below that is 8250 for S1, and then the 8215 level - which looks pretty decent as we have the S2, 200ema and key fib all here. Should it slide this low then a bounce here looks viable. There is also the green 2h coral at this level currently (though if it's tested later that may well have risen to the 8220 level. Ergo decent support here for a bounce.
Resistance wise, should the bulls manage to break above the 8325 level we would likely see 8353 R3, and the top of the 10d Raff channel which is also here. Both Raff channels heading up quite steeply now as the bulls remain in charge.
The US daily charts are also looking more bullish now with the daily EMAs crossing over to bull mode, and support on the S&P500 locking in at the 5108 level.
It's been "buy the dip" for a while now and that looks set to continue for the time being.
Good luck today.
Interested in how to start trading the FTSE 100? Frequently Asked Questions on Spread betting
Recommended Broker for FTSE 100 trading and how to start trading using support and resistance

IC Markets - offers market leading pricing and trading conditions by providing clients with True ECN Connectivity; this allows you to trade on institutional grade liquidity from the world’s leading investment banks, hedge funds and dark pool liquidity execution venues. Highly recommended!
Membership, Trading Tips, Support and Resistance Levels with Live Trading
If you would like more detailed analysis for FTSE 100, DAX, Gold and S&P, including the trades that I am looking to take myself, then please join my active members community.
What you get
- Daily Analysis pre market open (sent around 7am each day) for FTSE 100, DAX40, Gold and S&P 500.
- Daily email pre market includes my trading plan for the day including ORDER levels, with stops and targets/limits
- Telegram live trading room and group membership for discussion and realtime trade updates
Keep up to date with new content, free sign up below with just your email address
