
Technical analysis for 17th June 2026
Today's charts show a slightly different picture from yesterday:
- Nasdaq and S&P500 remain bullish but are consolidating after the breakout.
- DAX40 has lost some momentum and is now neutral-to-bullish.
- FTSE100 remains constructive inside its rising channel.
- Gold is stalling beneath resistance and looks range-bound.
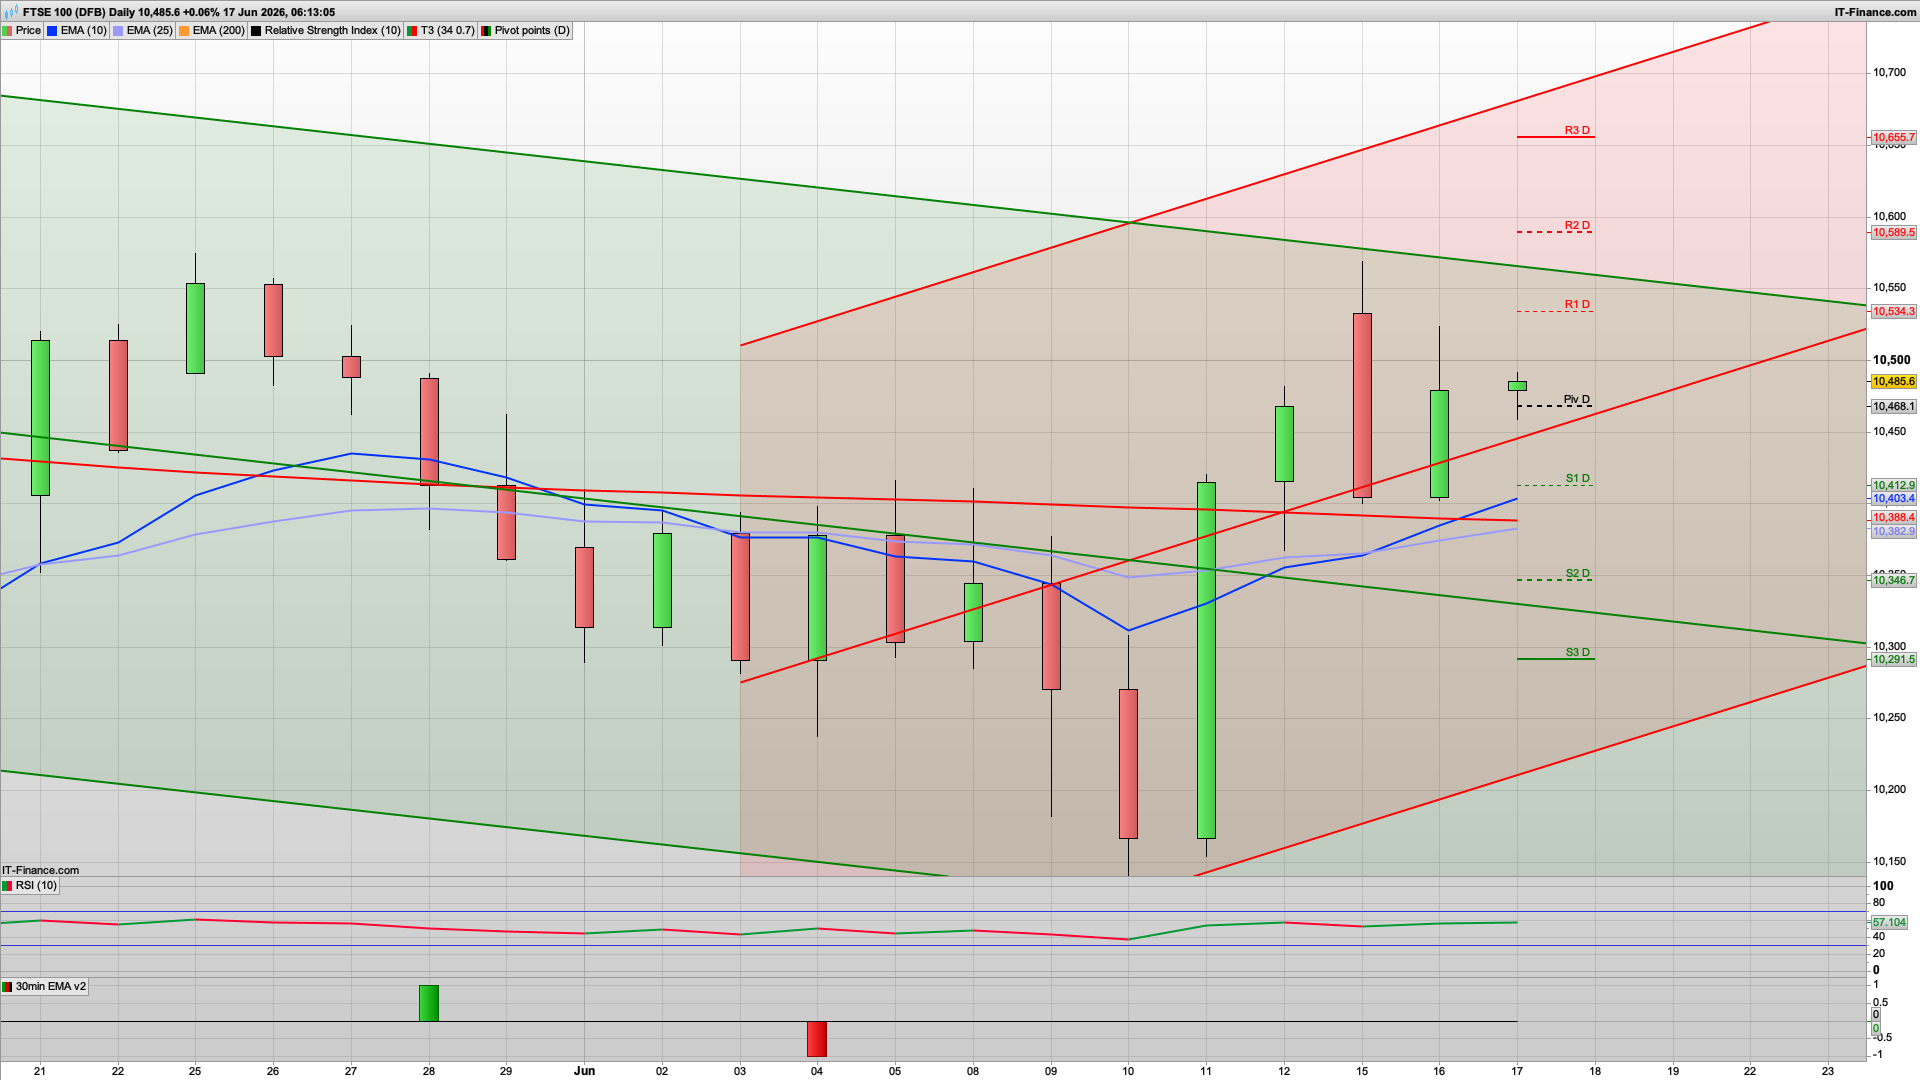
FTSE 100
- Bias: Bullish
- Strong rising channel.
- Trading above EMA25 and EMA200.
- RSI around 57 and improving.
- Higher highs and higher lows continue.
- Key Levels
- Resistance:
- 10,535
- 10,590
- 10,656
- Support:
- 10,412
- 10,347
- Resistance:
- Trading Plan
- Buy dips into the 10,420–10,450 area.
- Break above 10,535 targets 10,590+.
DAX 40
- Bias: Neutral / Slight Bullish
- Price sitting almost exactly on the daily pivot (24,879).
- EMA25 remains above EMA200.
- RSI around 54 and flat.
- Last two sessions show indecision after the strong recovery from 24,000.
- Key Levels
- Resistance:
- 25,036 (R1)
- 25,268 (R2)
- 25,424 (R3)
- Support:
- 24,705
- 24,491
- Resistance:
- Trading Plan
- Above 24,900 → bullish continuation.
- Below 24,700 → likely retracement toward 24,500.
Nasdaq 100
- Bias: Bullish
- Strong trend remains intact.
- Trading above EMA25 and EMA200.
- Holding well above the 29,800 breakout area.
- Small indecision candle after a strong rally often means consolidation before another push higher.
- Key Levels
- Resistance:
- 30,544
- 30,956
- 31,258
- Support:
- 29,831
- 29,528
- Resistance:
- Trading Plan
- Buy dips above 30,000.
- Bullish while above pivot (30,241).
S&P 500
- Bias: Bullish
- Strong recovery structure remains intact.
- EMA25 rising.
- Price holding above pivot.
- Momentum divergence remains supportive.
- Key Levels
- Resistance:
- 7,565
- 7,597
- 7,627
- Support:
- 7,502
- 7,477
- Resistance:
- Trading Plan
- Buy pullbacks toward pivot.
- Bullish while above 7,500.
Gold
- Bias: Neutral
- Rebound from 4,050 remains valid.
- However price is now trapped between pivot and resistance.
- Several small candles showing loss of momentum.
- Not seeing strong follow-through after the bounce.
- Key Levels
- Resistance:
- 4,358
- 4,380
- 4,406
- Support:
- 4,307
- 4,284
- Resistance:
- Trading Plan
- Above 4,358 → bullish breakout.
- Below 4,307 → likely pullback.
Other Opportunities Today
- Long Nasdaq
- Above 30,241 pivot
- Targets: 30,544 → 30,956
- Long S&P500
- Above 7,531
- Targets: 7,565 → 7,597
- Long FTSE100
- Above 10,460
- Targets: 10,535 → 10,590
- DAX40
- Wait for break of 25,000 or pullback into 24,700 support before committing.
- Gold
- Stand aside until 4,358 or 4,307 breaks.
Overall Market View
The dominant theme remains risk-on. U.S. indices continue to show the strongest trend structure, the FTSE is quietly trending higher, while the DAX is pausing after its recent rally. Gold has shifted from a trending market into a range market and currently offers the least attractive directional setup of the five charts.
Interested in how to start trading the FTSE 100? Frequently Asked Questions on Spread betting
Recommended Broker for trading - MT4/5, web and mobile

IC Markets - offers market leading pricing and trading conditions by providing clients with True ECN Connectivity; this allows you to trade on institutional grade liquidity from the world’s leading investment banks, hedge funds and dark pool liquidity execution venues. Highly recommended!
Join my Membership for Trading Tips, Support and Resistance Levels with Live Trading
If you would like more detailed analysis for FTSE 100, DAX40, Gold and the S&P500, including the trades that I am looking to take myself, then please join my active members community.
Keep up to date with new website posts, free sign up below
