
Technical analysis for 3rd February 2026
FTSE100 Bias
- Neutral → Slight Bullish Bias
- Structure: Still holding inside the rising channel
- Price Action: Holding above daily pivot and EMA zone
- Momentum: RSI recovering from mid-range, not overbought
- Bias:
- Bullish while above: ~10,150–10,170
- Upside targets: 10,260 → 10,300 (R1–R2 zone)
- Bearish flip below: ~10,120 (opens 10,050 → 10,000)
- Takeaway: Buy dips into support while structure holds.
S&P500 Bias
- Bullish Bias
- Structure: Higher lows inside rising channel
- Price Action: Holding above EMA and pivot zone
- Momentum: RSI supportive, not stretched
- Bias:
- Buy dips above: ~6,950
- Upside targets: 7,050 → 7,130
- Bearish flip below: 6,900
- Takeaway: Trend-following long bias unless pivot breaks.
DAX40 Bias
- Bearish Bias
- Structure: Lower highs, trading below declining channel top
- Price Action: Below key EMAs and struggling under pivot
- Momentum: RSI weak and failing to recover
- Bias:
- Sell rallies below: ~24,900–25,000
- Downside targets: 24,600 → 24,300
- Bullish flip only above: 25,050+
- Takeaway: Short rallies, trend still pointing lower.
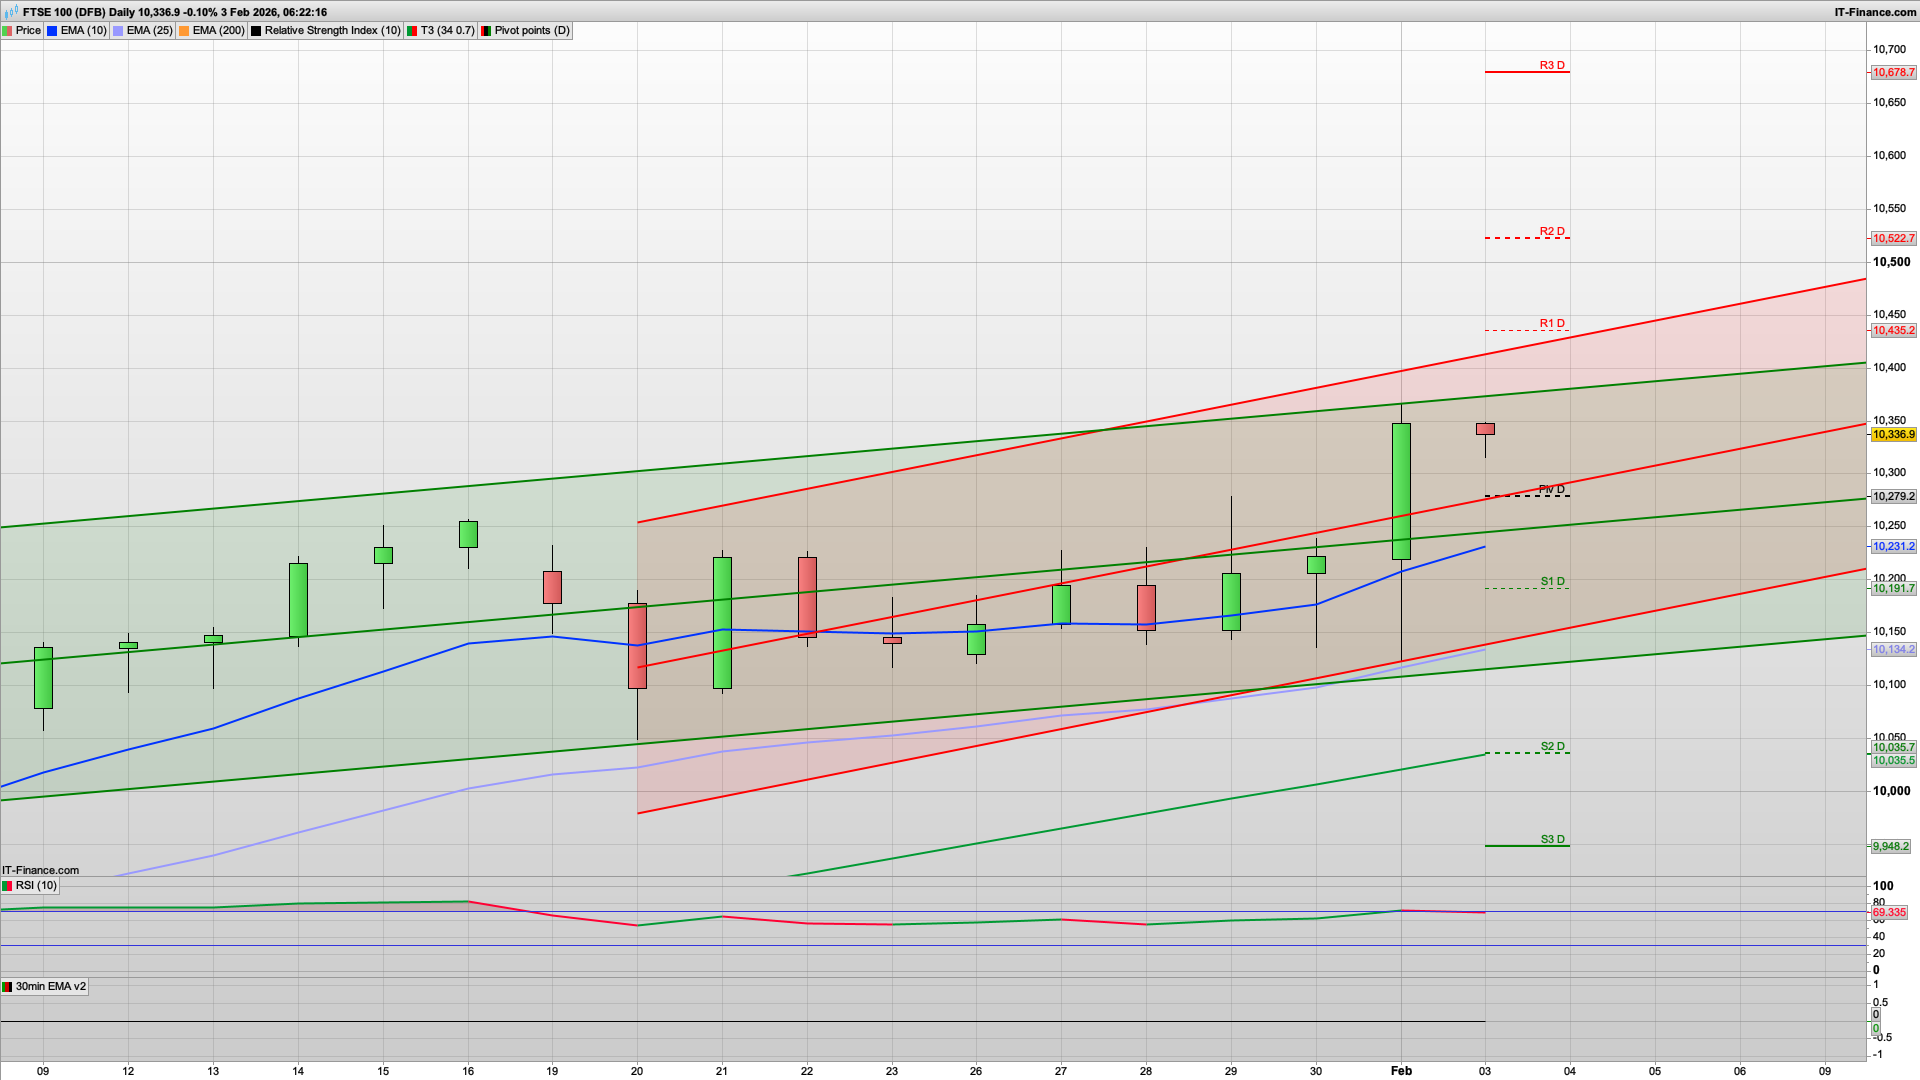
FTSE100 Roadmap
- Above 10,279: Buy dips → target 10,435 → 10,523
- Above 10,435: Momentum continuation → 10,650+
- Below 10,215: Pullback resumes → 10,135
Today’s Likely Path
- Early: Shallow pullbacks into 10,300–10,330
- Mid-session: Break attempt at 10,435
- Bull case: Extension to 10,523 → 10,650
- Bear case: Failure back to 10,215–10,135
An exceptionally bullish Bull Monday yesterday saw the FTSE100 close at a record high as the bulls fought back and the new month money also piled in. That may well carry on for a bit today but I am also mindful of a bear Tuesday kicking in, along with us nearing the daily resistance level at 10420. Initially we also have the key fib resistance at the 10365 level, along with yesterdays high there, so a drop down from there to test the daily pivot and the Hull MA at the 10260-10280 zone would make sense.
If the bulls were to break the 10365 then 10420 is next up as mentioned as the major resistance, and then 10435 R1. That sort of area will certainly generate the headlines, as the FTSE100 pushes past 10400! However, the top of the (still rising) Raff channels are around here at 10412 and 10375 (10 and 20d respectively) so it's an area that is worth exercising some caution.
An initial drop down then a rise would fit the DAX40 and S&P500 as well with tests of the daily pivot at 24665 and 6945 respectively. The 2h charts are also bullish after yesterdays rise, with support at the 24550 and 6951 levels.
For the FTSE100 bears, if they were to break the 10260 level then I am looking at the key fib level of 10215 as the next support and then 10191 S1 below that. However, do keep an eye on that pivot support at 10280 initially.
On the news front we have the US JOLTS job openings at 1500 so may well see some reaction around then.
Good luck today.
Interested in how to start trading the FTSE 100? Frequently Asked Questions on Spread betting
Recommended Broker for trading - MT4/5, web and mobile

IC Markets - offers market leading pricing and trading conditions by providing clients with True ECN Connectivity; this allows you to trade on institutional grade liquidity from the world’s leading investment banks, hedge funds and dark pool liquidity execution venues. Highly recommended!
Join my Membership for Trading Tips, Support and Resistance Levels with Live Trading
If you would like more detailed analysis for FTSE 100, DAX40, Gold and the S&P500, including the trades that I am looking to take myself, then please join my active members community.
Keep up to date with new website posts, free sign up below
