
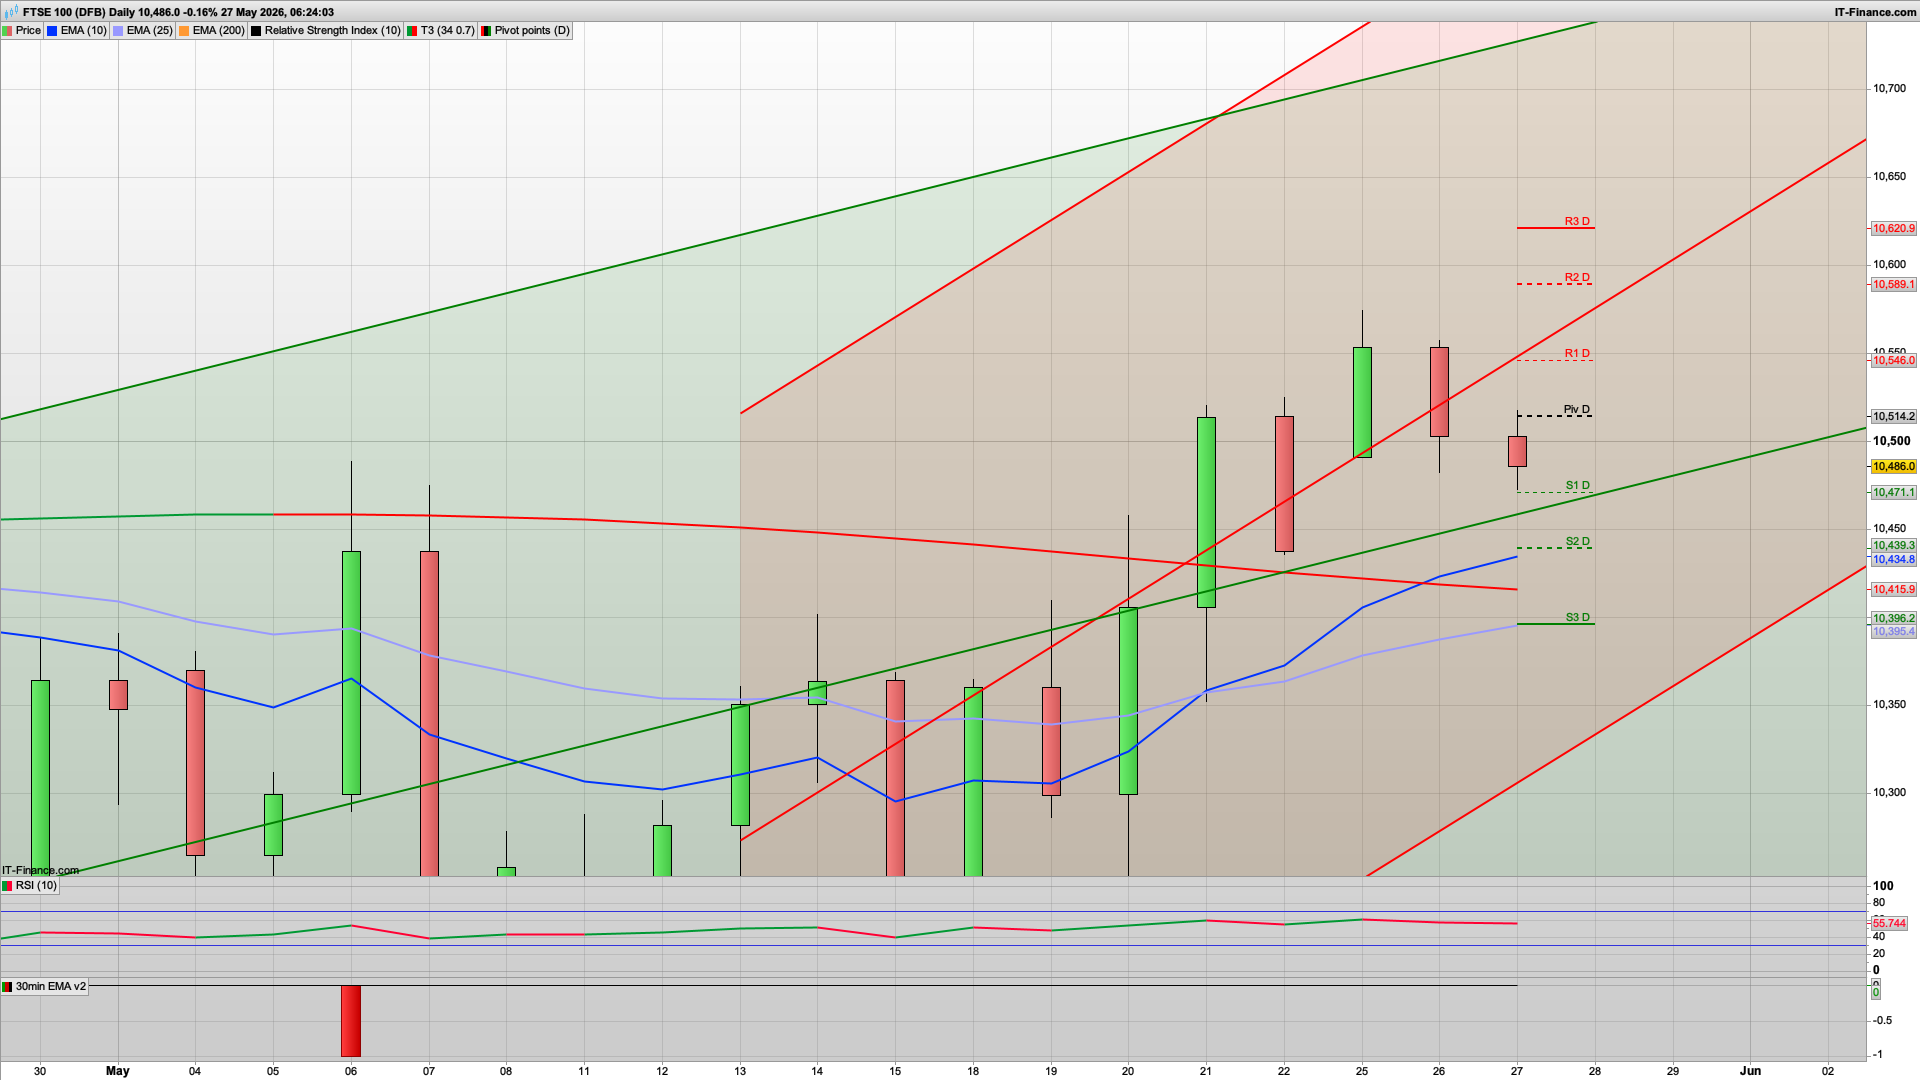
Technical analysis for 27th May 2026
FTSE100
- Bias: Neutral → slight bearish intraday
- Observations:
- Recent candles show hesitation around resistance
- Less momentum than US indices
- Slight loss of short-term strength
- Observations:
- Key levels:
- Support: 10,471 → 10,439
- Resistance: 10,546 → 10,589 → 10,621
- Trade idea:
- Prefer waiting for:
- reclaim above 10,550, or
- pullback into support before buying
- Prefer waiting for:
DAX40
- Bias: Bullish (buy dips)
- Observations:
- Still inside a rising channel
- Price holding above rising EMAs
- Small indecision candle near pivot after a strong move = pause rather than reversal
- Momentum remains constructive
- Observations:
- Key levels:
- Support: 25,257 → 25,138 → 25,046
- Resistance: 25,349 → 25,468 → 25,560
- Trade idea:
- Longs favoured above 25,250
- If price pushes above 25,350, continuation toward 25,470–25,560
NASDAQ
- Bias: Bullish breakout continuation
- Observations:
- Price has now pushed through 30k
- Strong EMA slope upward
- Daily structure remains very healthy
- Small pause candle after a breakout often precedes continuation
- Observations:
- Key levels:
- Support: 29,928 → 29,769
- Resistance: 30,185 → 30,344 → 30,600
- Trade idea:
- Buy pullbacks into 29,900–29,950
- Break above 30,180 could trigger another leg higher
S&P 500
- Bias: Bullish
- Observations:
- Trend channel intact
- Price sitting above pivot and above EMAs
- Momentum still positive
- Key levels:
- Support: 7,503 → 7,483
- Resistance: 7,541 → 7,560 → 7,579
- Trade idea:
- Buy dips rather than chase highs
- Bias only weakens below 7,500
Gold
- Bias: Bearish
- Observations:
- Downtrend channel still controlling price
- Trading below declining EMA structure
- Rejection from EMA/pivot zone continues
- Observations:
- Key levels:
- Resistance: 4,567 → 4,623 → 4,665
- Support: 4,468 → 4,426 → 4,370
- Trade idea:
- Sell rallies into resistance
- Avoid trying to catch bottoms
General sentiment snapshot
- Long US indices / short Gold
- The NASDAQ chart is the strongest-looking chart today because it's sitting above a major psychological level (30,000) with trend alignment still intact.
The bulls attempted to defend the 10500 yesterday but having dipped slightly below overnight they will need to be quick out the blocks this morning to push higher. To help with that we are just on the 30m 200ema at 10470 which may well see an early push up towards the 10520 resistance level and a key one that they will need to break. As such an initial test lf this may well then see a drop back and support at 10440 tested if 10470 breaks.
If they were to break above 10520 then we can look for a rise towards the 10565 level.
The daily chart remains bullish overall and has EMA support at the 10400 area and also S3 here, so should it get bearish down to that level I would like to see that hold for a bounce back. That said, I am thinking that the 10440 level is likely to hold as decent support if seen today.
The US markets remain pretty bullish and once again they may well help underpin the FTSE100. With the NASDAQ at 30000 and holding steady, we may well see continued upside past this key round number.
Interested in how to start trading the FTSE 100? Frequently Asked Questions on Spread betting
Recommended Broker for trading - MT4/5, web and mobile

IC Markets - offers market leading pricing and trading conditions by providing clients with True ECN Connectivity; this allows you to trade on institutional grade liquidity from the world’s leading investment banks, hedge funds and dark pool liquidity execution venues. Highly recommended!
Join my Membership for Trading Tips, Support and Resistance Levels with Live Trading
If you would like more detailed analysis for FTSE 100, DAX40, Gold and the S&P500, including the trades that I am looking to take myself, then please join my active members community.
Keep up to date with new website posts, free sign up below