
Technical analysis for 24th February 2026
FTSE100 Bias
- Bullish (but corrective pullback)
- Strong uptrend channel still intact
- Pullback candle into trend support / prior breakout area
- EMAs rising and price holding above the key daily trend line
- No structural lower low
- Bias: Buy dips (trend continuation after retrace)
S&P500 Bias
- Bearish bias
- Clear descending channel
- Price below the EMA stack
- Lower highs structure intact
- Pivot overhead acting as resistance
- Bias: Sell rallies
- Reversal only if it reclaims the channel top + EMAs.
DAX40 Bias
- Bullish bias
- Price holding above the rising EMA stack
- Still trading in the upper half of the ascending channel
- Yesterday = controlled pullback into dynamic support, not a breakdown
- Pivot sitting below price → support
- Bias: Buy the dip / continuation higher
- Only turns neutral if it loses the EMA cluster & channel mid.
Today’s directional bias
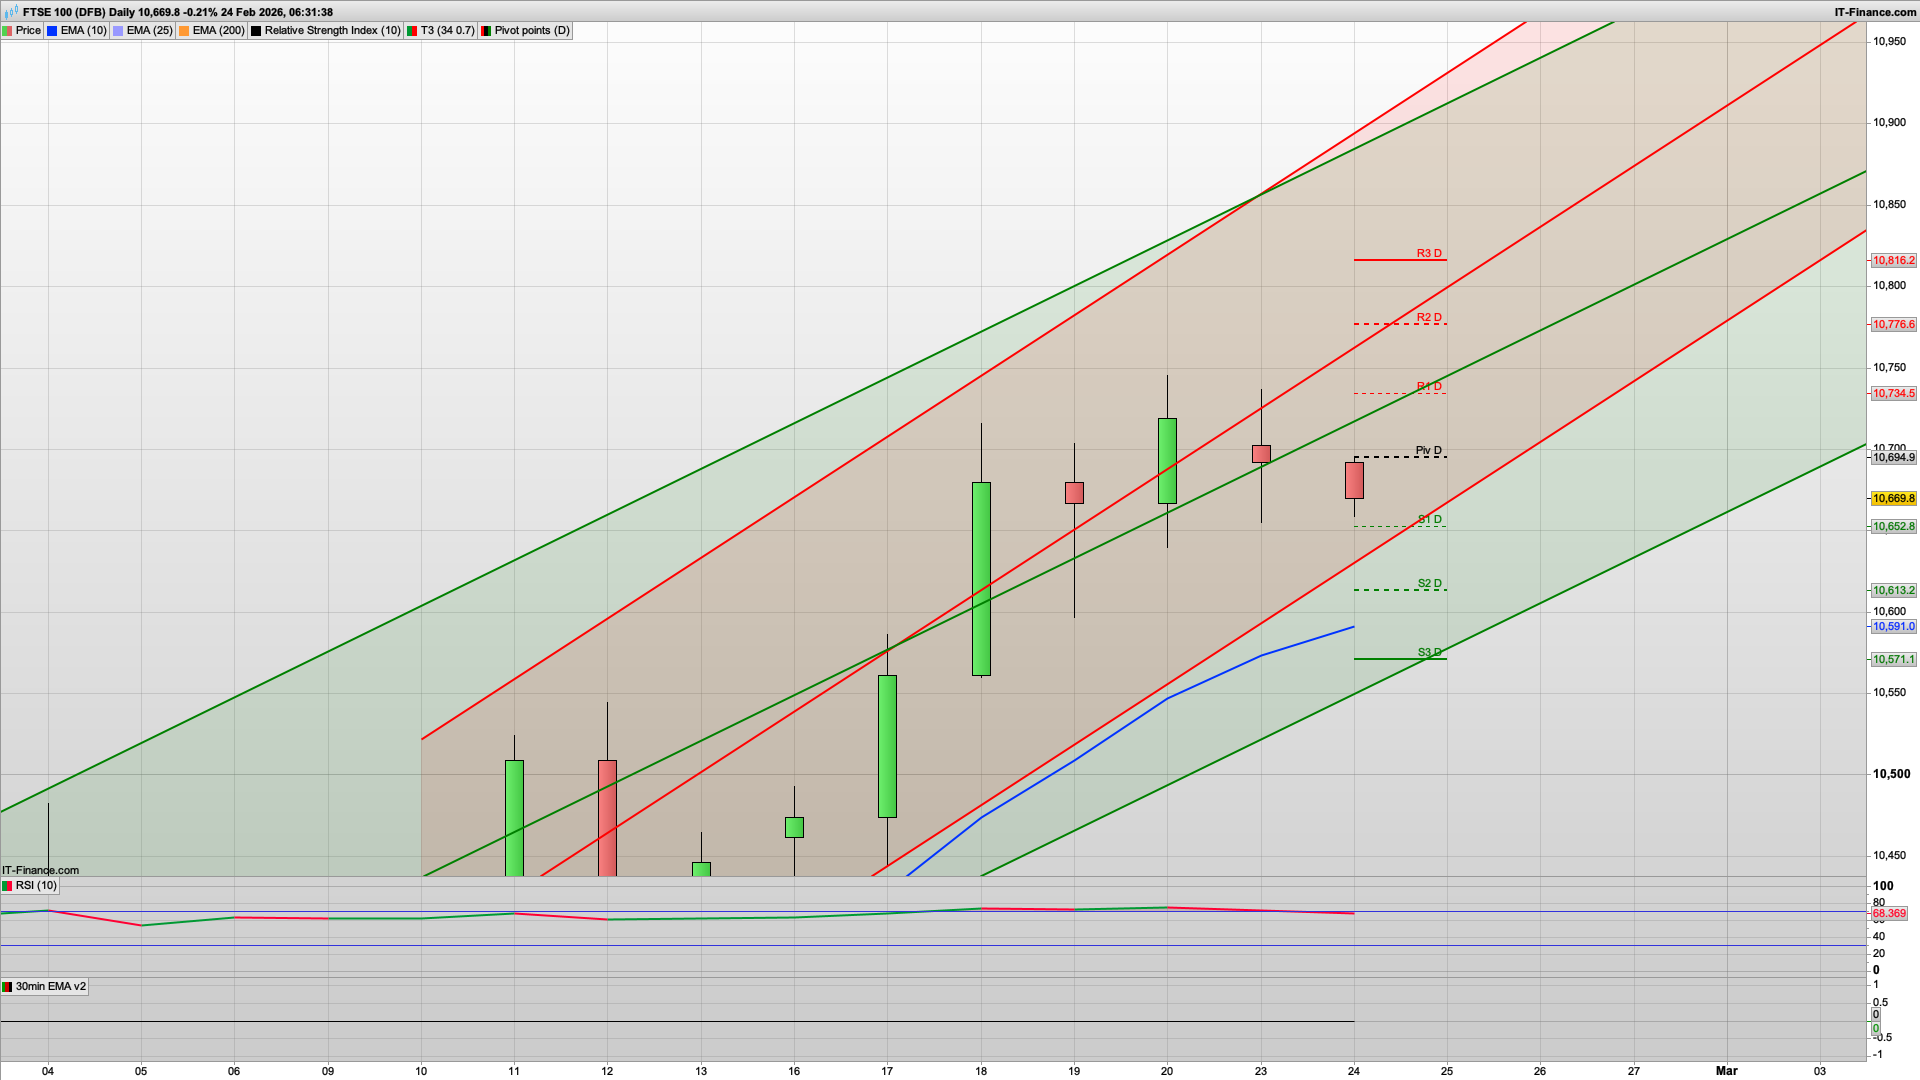
- Primary bias: Bullish above 10,653
- Flip bearish only if 10,613 breaks and holds
Expected session behaviour
- Typical FTSE flow given current structure:
- Early dip into S1 / liquidity sweep
- Reversal → grind back toward pivot
- US open decides if R1 breaks
The bulls have continued to defend the 10660 level whilst failing to break the 10740 level so that's the range in play today. We may well see a bit of bear Tuesday initially for a drop down into the 30m 200ema and S1 area at 10645 as we have initial resistance at the 10690 level from the 30m coral, and also the daily pivot here, and we are sat on this level as I am writing this. The 2h chart also remains bearish, with the Hull MA once again acting as resistance yesterday and the 10731 level.
If we do get an early flush down towards the 10645 area then it would be good to see this hold for another attempt to push past and hold 10700, though with the US currently weighing things down, the bulls have a flight on their hands. Below 10645 then the bears will be aiming for the S2 area at 10615 and we also have the key fib here, although just below these is the 10600 daily support - ergo if we were to get this low then a bounce here would make sense.
On the bullish side, above the 10690 daily pivot then the bulls will be aiming for 10740 as mentioned, and then we still have the 10782 daily resistance level higher still - might be a bit optimistic for a bear Tuesday but you never know. If we were to see that then a short here is also worth taking.
We don't have any really major UK centric news out today, but with the Raff channels still firmly heading up on the daily chart the bias remains bullish for the time being and we are still in buy the dip territory on the longer timeframes.
Good luck today.
Interested in how to start trading the FTSE 100? Frequently Asked Questions on Spread betting
Recommended Broker for trading - MT4/5, web and mobile

IC Markets - offers market leading pricing and trading conditions by providing clients with True ECN Connectivity; this allows you to trade on institutional grade liquidity from the world’s leading investment banks, hedge funds and dark pool liquidity execution venues. Highly recommended!
Join my Membership for Trading Tips, Support and Resistance Levels with Live Trading
If you would like more detailed analysis for FTSE 100, DAX40, Gold and the S&P500, including the trades that I am looking to take myself, then please join my active members community.
Keep up to date with new website posts, free sign up below
