
Technical analysis for 13th May 2026
FTSE 100
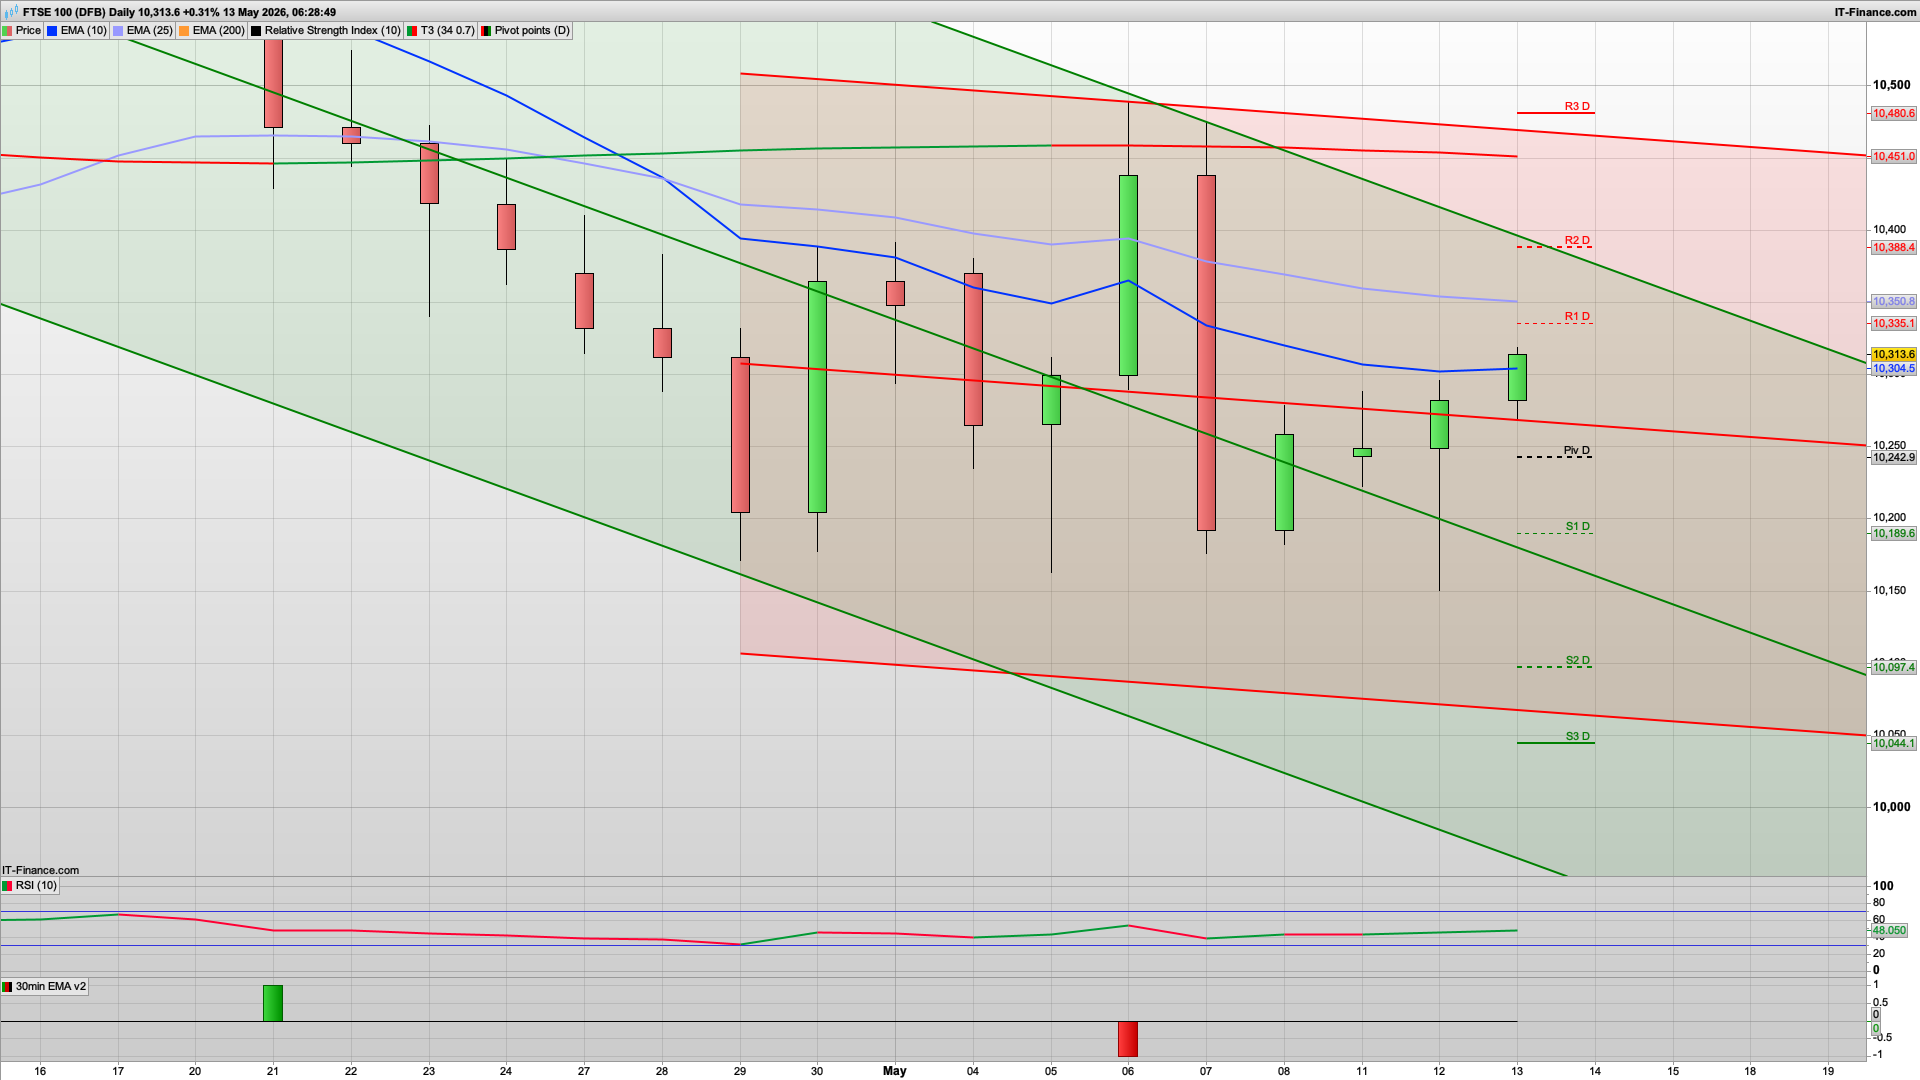
- Bias: Neutral → slightly bullish recovery
- FTSE finally stabilising after prolonged weakness
- Recovering inside falling channel
- Still below major moving average resistance, so upside may be limited
- Key levels
- Resistance: 10,351 → 10,388 → 10,451
- Support: 10,243 → 10,190 → 10,097
- Trading view
- Mild bullish bias above 10,240
- But rallies into 10,350+ could still face sellers
- Needs breakout above falling trendline for proper reversal
- FTSE improving, but still weaker than US markets.
DAX40
- Bias: Neutral → mildly bearish
- Market still struggling beneath the mid-channel resistance and pivot region
- Recent candles show loss of upside momentum after sharp rejection from 25k area
- EMA support below is still holding for now, preventing a full bearish breakdown
- Key levels
- Resistance: 24,256 → 24,476 → 24,642
- Support: 24,090 → 23,870 → 23,700
- Trading view
- Prefer fading rallies into 24,250–24,400
- Only turns bullish again above 24,500
- Below 24,000 would likely trigger a deeper correction leg
- DAX currently looks range-bound with downside pressure building.
NASDAQ
- Bias: Bullish continuation
- Trend channel remains very strong
- Price holding comfortably above pivot and rising EMA structure
- Small pause candle after strong run suggests consolidation, not reversal
- Key levels
- Resistance: 29,370 → 29,594 → 29,962
- Support: 29,000 → 28,778 → 28,410
- Trading view
- Buy dips remains the higher-probability play
- Momentum leadership still belongs to tech
- A clean break above 29,370 could accelerate toward 29,600+
- NASDAQ remains the strongest chart here.
S&P 500
- Bias: Bullish
- Strong rising channel intact
- Price riding upper half of trend structure
- Higher lows continue to form
- Key levels
- Resistance: 7,436 → 7,461 → 7,510
- Support: 7,387 → 7,362 → 7,313
- Trading view
- Bullish while above 7,387 pivot support
- Pullbacks likely bought
- Momentum weaker than NASDAQ but still constructive
- Structure remains healthy overall.
GOLD
- Bias: Neutral / range-bound
- Gold stuck between rising support and overhead resistance
- Momentum mixed with indecisive candles around pivot
- No strong directional conviction yet
- Key levels
- Resistance: 4,778 → 4,845 → 4,917
- Support: 4,646 → 4,575 → 4,510
- Trading view
- Sell failed rallies near resistance
- Buy only on confirmed breakout above 4,780+
- Likely rotational price action unless macro catalyst appears
- Gold still trading more like a range than a trend.
Best Looking Trades Today
- Strongest Longs
- NASDAQ dip buys
- S&P continuation longs
- Strongest Shorts
- DAX rallies into resistance
- Gold failed breakouts near resistance
- More Balanced / Range Conditions
- FTSE
- Gold
Key Theme Today
- US indices still show leadership and trend strength, especially tech. Europe remains more fragile and rotational. Unless US futures roll over hard after the open, the broader path still favours:
- US strength
- European underperformance
- Gold consolidation rather than trend expansion.
Despite breaking the 10180 support the bulls managed to defend the 10150 instead yesterday and that has set up a decent bounce that looks set to continue and maybe reverse the current bearish overtones on the FTSE100. Initially today we have support at the 10270 level with the 30m coral and 200ema here with the daily pivot at 10243 below this. I am thinking that the bulls will try and defend any dip today and once again the US markets may well help pull up the FTSE100.
Below the 10240 level then the bears will be looking for the 10190 area where we have S1 and the key fib.
On the upside, the 10335 R1 is initial resistance if the bulls were able to be quick out the blocks and break the key fib at 10310. Higher up then the 10388 level is worth a short as we have R2 and the top of the 20d Raff channel here. After yesterday's climb the 2h chart is bullish again with Hull MA support at the 10220 level should it really drop... look for support here.
Once again the bulk of the news focus will be on Kier Starmer and will he or won't he resign. He is rapidly losing more and more party support so it's probably going to be the former, with Wes Streeting the front runner of the replacements.... crunch meeting between them today at number 10.
Good luck today.
Interested in how to start trading the FTSE 100? Frequently Asked Questions on Spread betting
Recommended Broker for trading - MT4/5, web and mobile

IC Markets - offers market leading pricing and trading conditions by providing clients with True ECN Connectivity; this allows you to trade on institutional grade liquidity from the world’s leading investment banks, hedge funds and dark pool liquidity execution venues. Highly recommended!
Join my Membership for Trading Tips, Support and Resistance Levels with Live Trading
If you would like more detailed analysis for FTSE 100, DAX40, Gold and the S&P500, including the trades that I am looking to take myself, then please join my active members community.
Keep up to date with new website posts, free sign up below
