
Technical analysis for 20th March 2026
FTSE 100 — Bearish
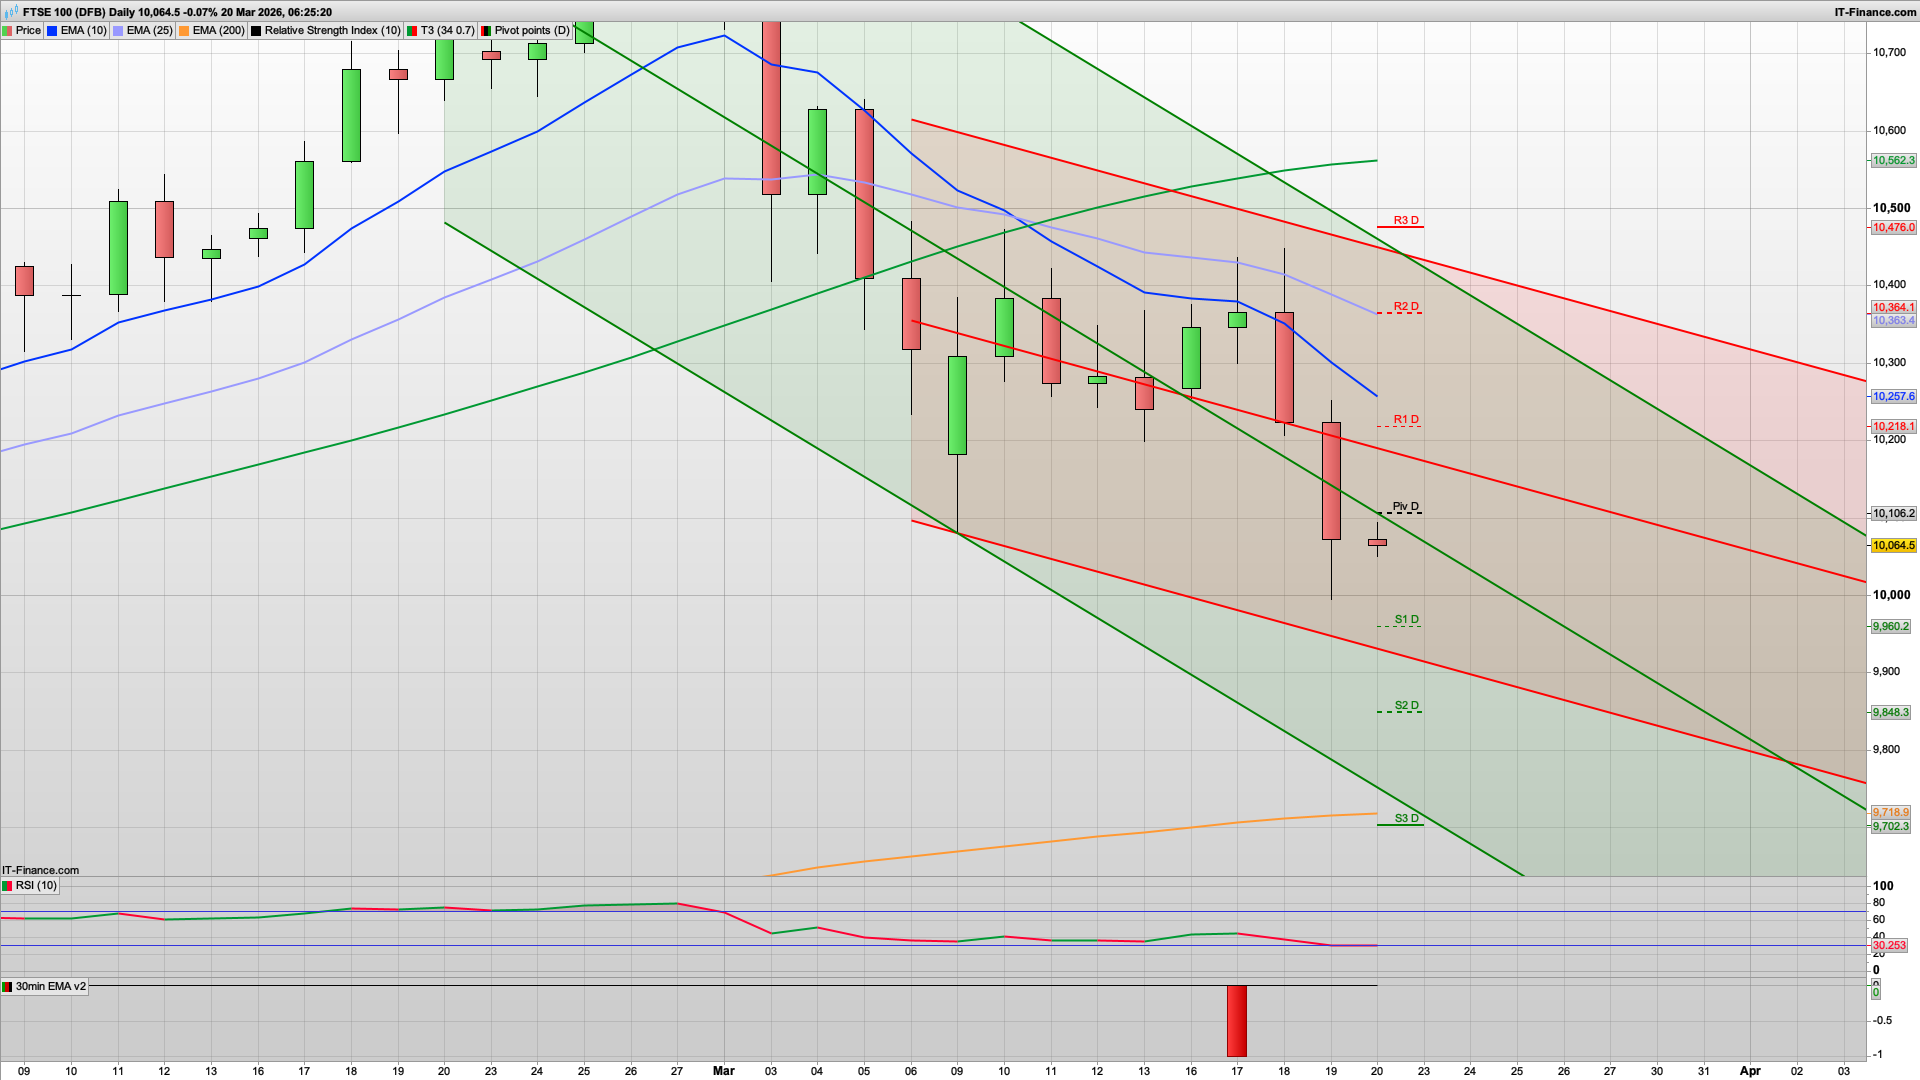
- Structure
- Clear rejection from EMA / pivot resistance
- Strong bearish candle recently
- Lower highs intact
- Still inside descending channel
- FTSE now fully aligned with global weakness.
- Bias: Sell rallies
DAX — Bearish continuation (weak bounce)
- Structure
- Still inside a clean descending channel
- Price holding below pivot
- EMAs firmly downward
- Small indecision candle after selling → no real reversal
- Bias: Sell rallies
NASDAQ — Bearish trend intact
- Structure
- Lower highs + lower lows continue
- Price below pivot
- EMAs sloping down
- Weak follow-through after rejection
- No signs of strength yet.
- Bias: Sell strength
S&P 500 — Bearish continuation
- Structure
- Strong downward channel
- Price sitting near pivot / support
- EMAs downward
- Weak candles → trend pressure still down
- Bias: Sell rallies
GOLD — Bearish but short-term bounce
- Structure
- Strong selloff followed by small bullish candle
- Still below pivot + EMA resistance
- Trend remains downward
- Bounce looks corrective only
- Bias: Sell rallies (after bounce)
The sell off accelerated yesterday with a test of 10000 and that remains the support in the short term for today. If the bears were to push below this then I am looking at a test of the 9960 level and a possible bounce off this back towards the daily pivot at 10106.
If the bears were to break below 9960 then the FTSE100 is quite capable of shedding another 100 to test the 9860 level - and look even more bearish. Generally we are still in short the rallies mode as the war continues to escalate as Iran retaliates by targeting energy and water infrastructure. The problem now is that it continues to escalate and the tit for tat gets more and more significant, with more countries getting drawn in. Saudi have already said that they will retaliate if their infrastructure continues to be hit.
On the flip side and on a more positive note, if the 10000 level does mark the short term low and also holds any test today then the bulls are capable of pushing up towards the 10106 daily pivot level initially, and possibly the daily resistance level at 10138. This may well see the "short the rally" mob have a go here though a break of this will be looking for 10175 Hull MA on the 2h chart, and then possibly 10275 which is the daily and 2h coral.
If we do climb to those sort of levels then it may well be seen as a bit of a false rally/dead cat bounce as the underpinnings haven't changed much, nor did the BoE help much yesterday keeping rates on hold. However, the more the bulls can pull away from the 10000 level, the better the charts and sentiment will start to look.
So, given all the levels mentioned, I am more inclined to go with a bit of positivity today and we get a climb to test the resistance levels - the bulls will certainly be looking to defend the 10000 level, and if we do get a fake break down to test S1 then a bounce here would be good.
Good luck today and have a great weekend.
Interested in how to start trading the FTSE 100? Frequently Asked Questions on Spread betting
Recommended Broker for trading - MT4/5, web and mobile

IC Markets - offers market leading pricing and trading conditions by providing clients with True ECN Connectivity; this allows you to trade on institutional grade liquidity from the world’s leading investment banks, hedge funds and dark pool liquidity execution venues. Highly recommended!
Join my Membership for Trading Tips, Support and Resistance Levels with Live Trading
If you would like more detailed analysis for FTSE 100, DAX40, Gold and the S&P500, including the trades that I am looking to take myself, then please join my active members community.
Keep up to date with new website posts, free sign up below
