
Technical analysis for 16th March 2026
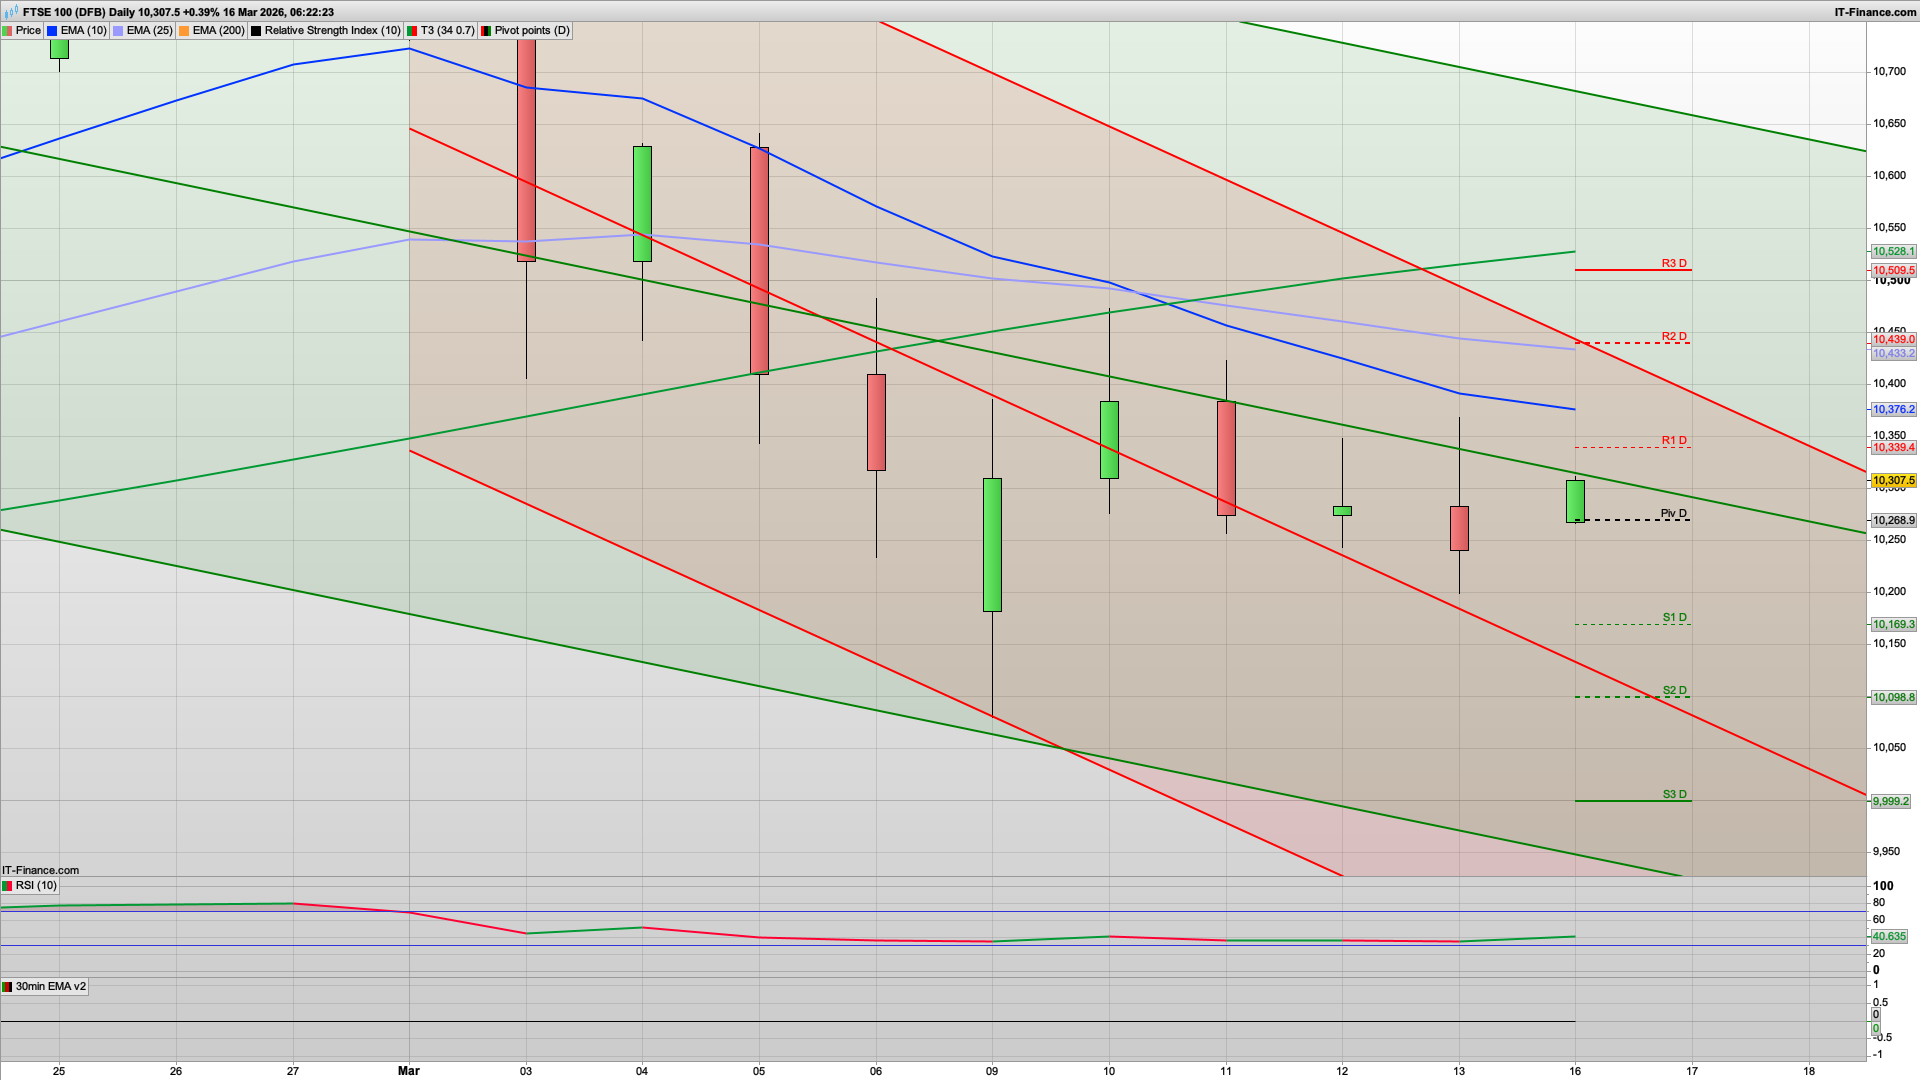
FTSE 100 — Neutral → slight bearish
- Structure
- Price hovering around pivot
- EMAs still pointing down
- Inside descending corrective channel
- Recent candles showing indecision
- Market may range early.
- Bias: Neutral / slight sell bias
DAX — Bearish trend still dominant
- Structure
- Price still inside a descending channel
- EMAs stacked downward
- Market sitting just above the daily pivot
- Lower highs structure intact
- The small green candle is only a bounce within the downtrend.
- Bias: Sell rallies
NASDAQ — Bearish but attempting stabilisation
- Structure
- Large sell candle previously
- Price now hovering around pivot
- EMAs still trending down
- Market still inside descending structure
- Momentum remains weak but volatility may compress.
- Bias: Neutral early → sell strength
S&P 500 — Bearish continuation
- Structure
- Clear descending channel
- Price below EMA cluster
- Pivot overhead resistance
- Lower highs continuing
- Trend remains firmly downward.
- Bias: Sell rallies
GOLD — Bearish correction
- Structure
- Price below pivot
- Rejected from EMA resistance
- Lower highs forming
- Momentum weakening
- Gold currently in short-term corrective phase.
- Bias: Sell rallies
It's looking tentatively bullish to start with, and a decent chance of a dip to the daily pivot support at the 10270 level and then a bounce for a bull Monday to play out. That said, the market looks like it could be a bit muted today and not as volatile as we have seen (famous last words). The bulls will be keen to keep the price above the 10300 level if they can, and a rise towards the 10340 R1/key fib level looks possible for today.
The daily chart remains bearish so on the longer time frame we still have EMA resistance at the 10430 area, so any rise to this area may well falter early this week.
If the bears were to break below the pivot then 10200 being Friday's low is next major support, with the key fib at 10193 just below this so I would expect to see a decent hold of this level if seen. That is also just above S1 for today at 10169, though generally we may well see a bull Monday, albeit a slighted muted one.
If the bulls were to break the 10340 level early on then 10400 looks distinctly possible in fairly short order so keep an eye on a break of that.
The S&P is looking optimistic also, currently gapped above 6620 closing level on Friday, and again with daily pivot support at 6658 to start with. If the bulls do keep the momentum then the 6723 area looks to be decent initial resistance with the key fib and 30m 200ema here.
Generally it's looking like a buy the dip day, and a slow drift higher.
Good luck today.
Interested in how to start trading the FTSE 100? Frequently Asked Questions on Spread betting
Recommended Broker for trading - MT4/5, web and mobile

IC Markets - offers market leading pricing and trading conditions by providing clients with True ECN Connectivity; this allows you to trade on institutional grade liquidity from the world’s leading investment banks, hedge funds and dark pool liquidity execution venues. Highly recommended!
Join my Membership for Trading Tips, Support and Resistance Levels with Live Trading
If you would like more detailed analysis for FTSE 100, DAX40, Gold and the S&P500, including the trades that I am looking to take myself, then please join my active members community.
Keep up to date with new website posts, free sign up below
