
Technical analysis for 19th October 2026
Global markets begin the new week with a clear divide between the strength of UK equities and the continuing weakness in US technology shares. The FTSE 100 finished Friday at another seven-week high, while the S&P 500 suffered its worst session since June. Meanwhile, government bonds have staged a significant recovery as investors become increasingly concerned about the cost of financing the artificial intelligence boom.
Oil prices are retreating this morning, providing some relief for inflation expectations, although disruption around the Strait of Hormuz remains a major concern. The most important question this week is whether falling Treasury yields can stabilise technology shares, or whether the AI-related correction has further to run.
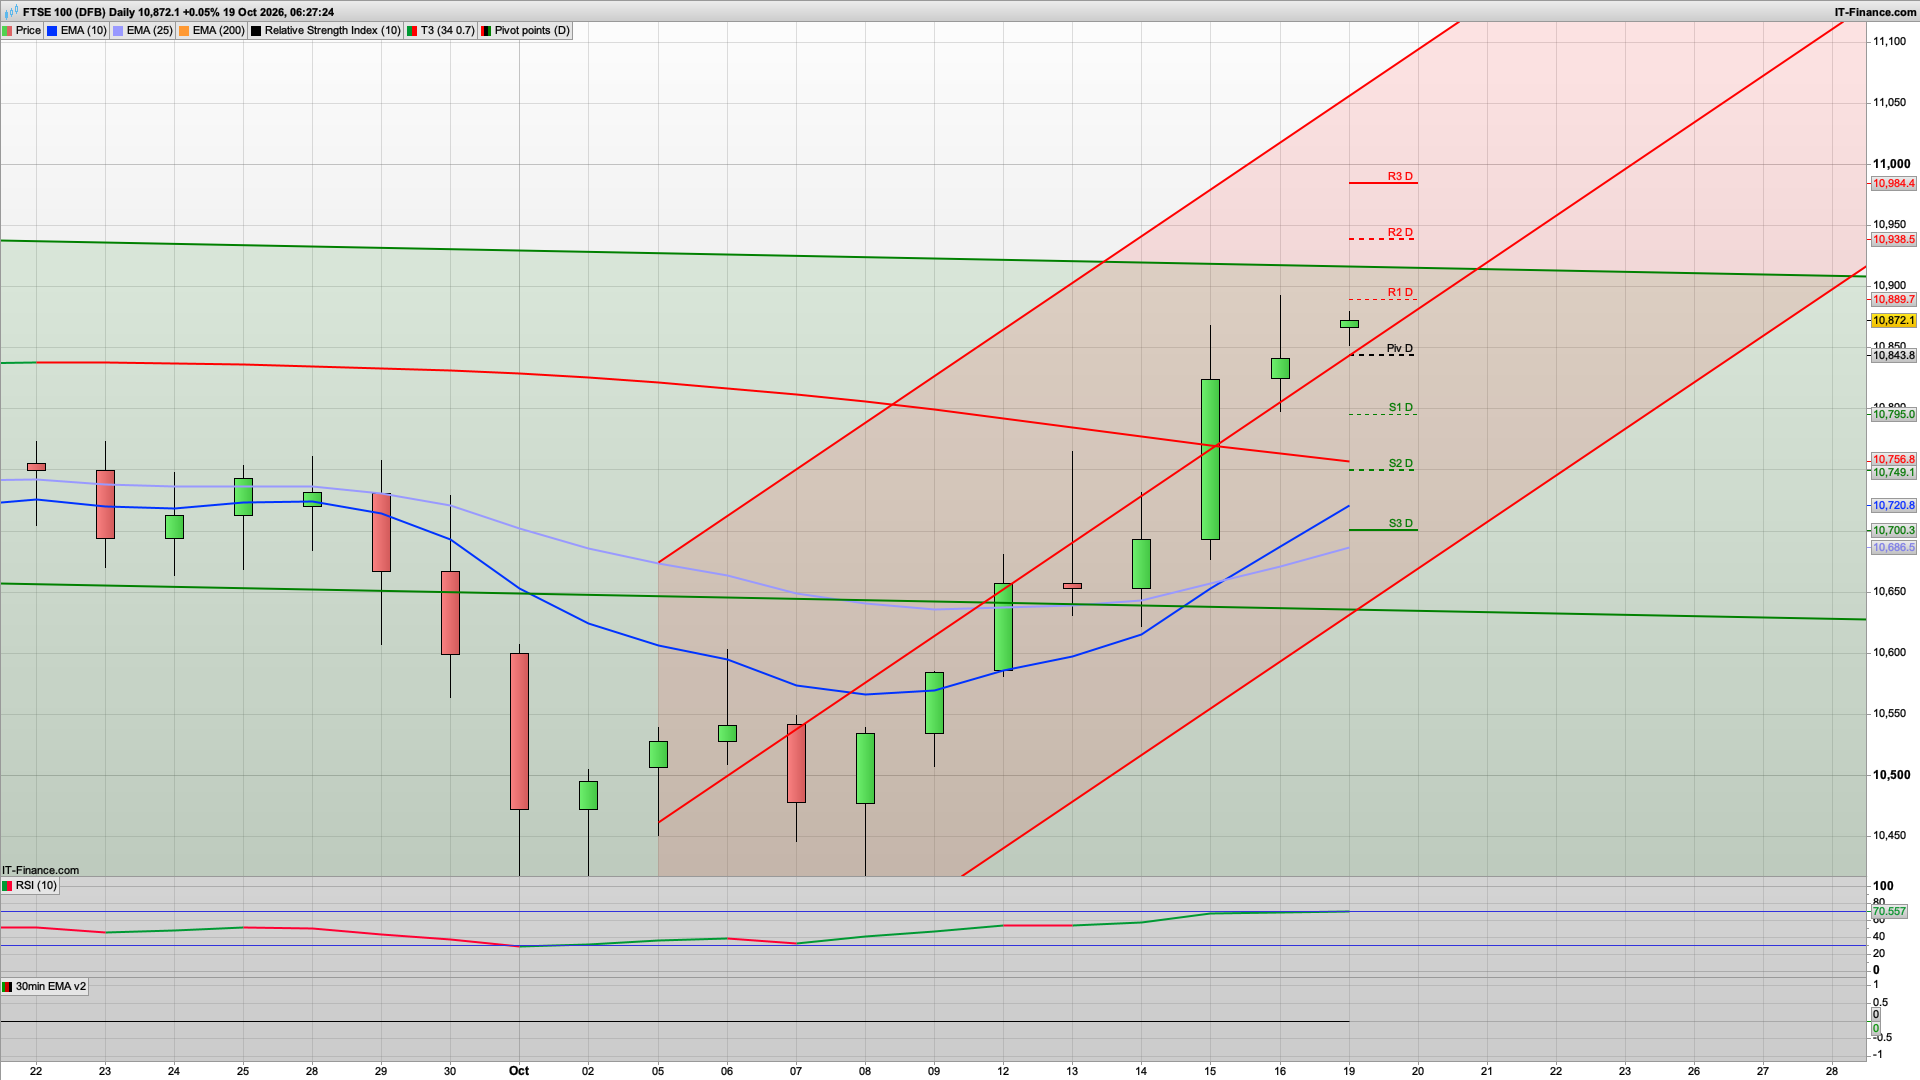
The FTSE 100 is looking bullish again this morning, with the DFB trading around 10,872 as I write this. The recovery that began at the start of October has continued, and the FTSE is now approaching another important technical test.
The daily chart shows a strong sequence of higher lows, with price comfortably above both its 10 and 25 EMAs. Daily RSI has reached approximately 70.5, indicating strong momentum but also suggesting the market is becoming overbought.
Meanwhile, the 30-minute chart shows price consolidating just below 10890, where R1 resistance is located.
My prediction today is for an attempt to break 10890, potentially opening a move towards 10938. However, I expect some profit-taking around resistance, so I'd favour buying a confirmed pullback rather than chasing the rally. That dip back could target the daily pivot level at 10843 so a long here would make sense as it's also just above the gap from Friday evening.
If the bears were to break this though then I am looking at the 10795 S1 level next up, as that is also the 10800 daily support level. Ergo a long where would also be worth a go.
Ultimately a test of the 10938 and 10943 daily level would be good today for a bull Monday session once again. A break of this would likely drive the bulls towards 11000 and higher (11059 is the next daily resistance level). The FTSE100 has proven quite resilient in October and steadily trended upwards as you can see on the daily chart below. Buying the dips on the longer timeframes is therefore still the bias.
For more more analysis including other markets please join...
Interested in how to start trading the FTSE 100? Frequently Asked Questions on Spread betting
Recommended Broker for trading - MT4/5, web and mobile

IC - offers market leading pricing and trading conditions by providing clients with True ECN Connectivity; this allows you to trade on institutional grade liquidity from the world’s leading investment banks, hedge funds and dark pool liquidity execution venues. Highly recommended!
Join my Membership for Trading Tips, Support and Resistance Levels with Live Trading
If you would like more detailed analysis for FTSE 100, DAX40, Gold and the S&P500, including the trades that I am looking to take myself, then please join my active members community.
Keep up to date with new website posts, free sign up below