
Technical analysis for 20th February 2026
FTSE100 Bias
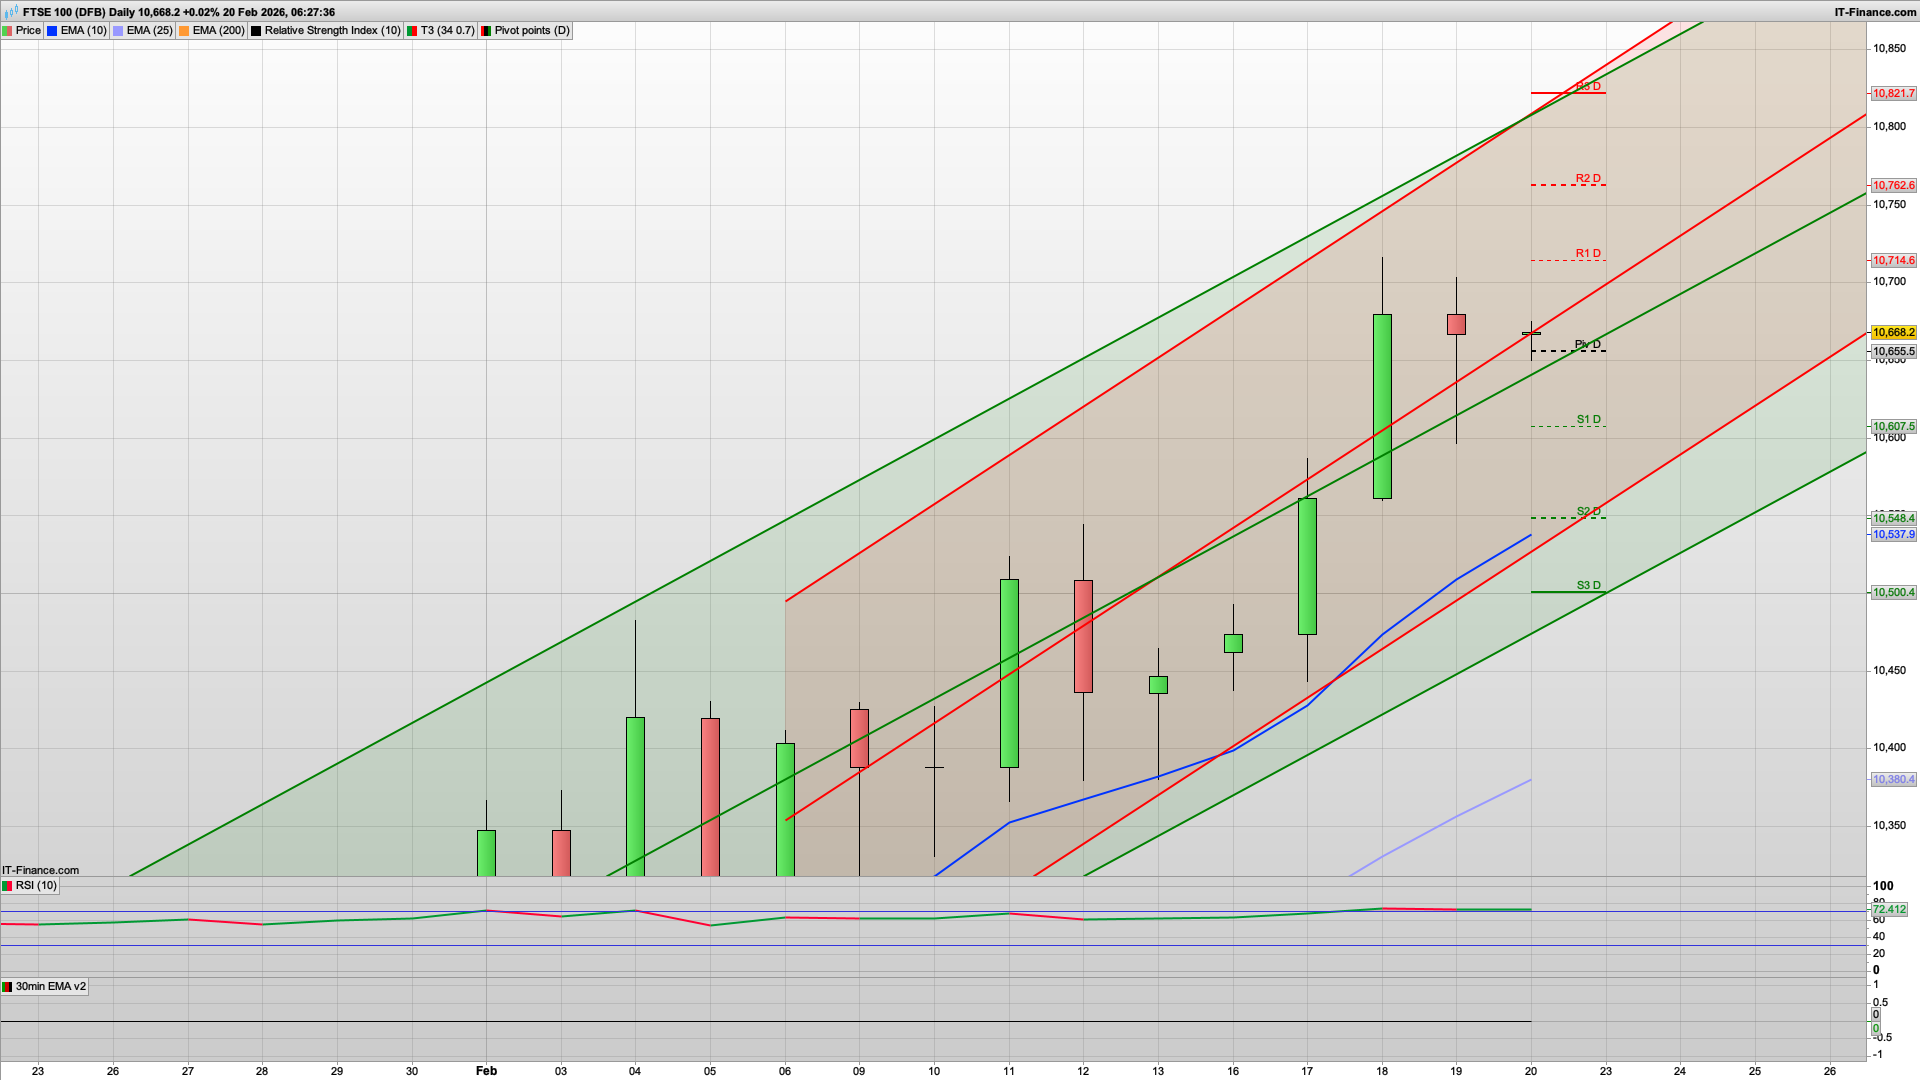
- Bias: STRONG BULLISH → continuation trend
- Clean impulsive move up the rising channel
- All EMAs aligned bullish and expanding
- Price holding above pivot after breakout
- Momentum candles = trend strength
- Upside targets:
- R1 → R2 → channel high
- Invalidation:
- Daily close back below pivot → pullback toward S1 (buy-dip zone)
S&P500 Bias
- Bias: NEUTRAL → slight BULLISH if pivot holds
- Still inside broader falling channel
- EMAs flat / slightly bearish → trend not fully flipped
- Reclaim of pivot = key for upside continuation
- Higher low printed → buyers trying to regain control
- Bull scenario:
- Hold above pivot → grind to R1 → R2
- Bear scenario:
- Failure at pivot → S1 → S2 continuation inside channel
DAX40 Bias
- Bias: BULLISH → buy dips while above pivot
- Price holding inside rising daily channel
- Structure = higher highs & higher lows
- Trading above 10/25/200 EMA cluster
- Pivot reclaimed and acting as support
- Upside targets:
- R1 → R2 → R3 (trend-channel high)
- Invalidation:
- Acceptance below pivot → move to S1
The bears drove it down yesterday as the dip and rise played out, albeit slightly below the support to test the 10600 round number. That is now the line in the sand that the bulls need to defend and as it's Friday we may well see a rise and dip play out today instead, as they try and build on the bounce form 10600. The initial support is at the 10650 level where we have the daily pivot and the green 30m coral so look for a long here, for a potential climb towards the 10720 area to test the key fib and R1.
We also have daily resistance here being the recent high so the bulls may struggle to push past this, especially as the USA Iran rhetoric is ramping up again and we my well see some attacking going on soon. Banking profits ahead of the weekend may well cap too much upside.
If they do manage to push higher then 10762 is R2 with 10782 above that - both of which feel a bit optimistic despite the bullish overtones still permeating through the FTSE100. The 2h chart is also bearish with 10675 Hull MA resistance, but the bulls have been trying to break this moving average since yesterday evening and it hasn't dropped significantly so far.
If the bears were to break the 10650 level though then 10600 is on the cards again, with daily support and just below 10607 S1, with the 10565 level the next daily support below that.
We have PMI news out at 0930 so we may well see some volatility kick in then, followed by the US GDP and PCE at 1330 - again expect some movement then.
I can see a similar rise and dip pattern for the DAX40 and S&P500 today with 25248 and 6910 resistance levels respectively.
Good luck today and have a great weekend.
Interested in how to start trading the FTSE 100? Frequently Asked Questions on Spread betting
Recommended Broker for trading - MT4/5, web and mobile

IC Markets - offers market leading pricing and trading conditions by providing clients with True ECN Connectivity; this allows you to trade on institutional grade liquidity from the world’s leading investment banks, hedge funds and dark pool liquidity execution venues. Highly recommended!
Join my Membership for Trading Tips, Support and Resistance Levels with Live Trading
If you would like more detailed analysis for FTSE 100, DAX40, Gold and the S&P500, including the trades that I am looking to take myself, then please join my active members community.
Keep up to date with new website posts, free sign up below
