
Technical analysis for FTSE 100 for 9th October 2025
The bulls managed a small move above the 9560 resistance before it dropped back, and that has put the 9580 level as the line in the sand now, with the 9608 still on the radar above that. Initial resistance today is at the 9550 area as we have the red 30m coral here and its just above the daily pivot resistance at 9538. 9540 is also the Hull MA level and whilst still technically bullish, its weakened off given yesterdays drop.
Initially i am thinking that we will see a rise to test this level before the bears try again. They will be looking to break below the 30m 200ema at 9490 and 9479 key fib, as that would open up the potential for a drop down to the S2 level 9443.
If the bears were to do this then I can then see a bounce here as the bulls will be looking to get the price back above 9500 to end the week strongly tomorrow.
Above the 9550 level then 9580 as mentioned, and then the 9608 daily resistance level is the next one above that to look for and worth a short if seen.
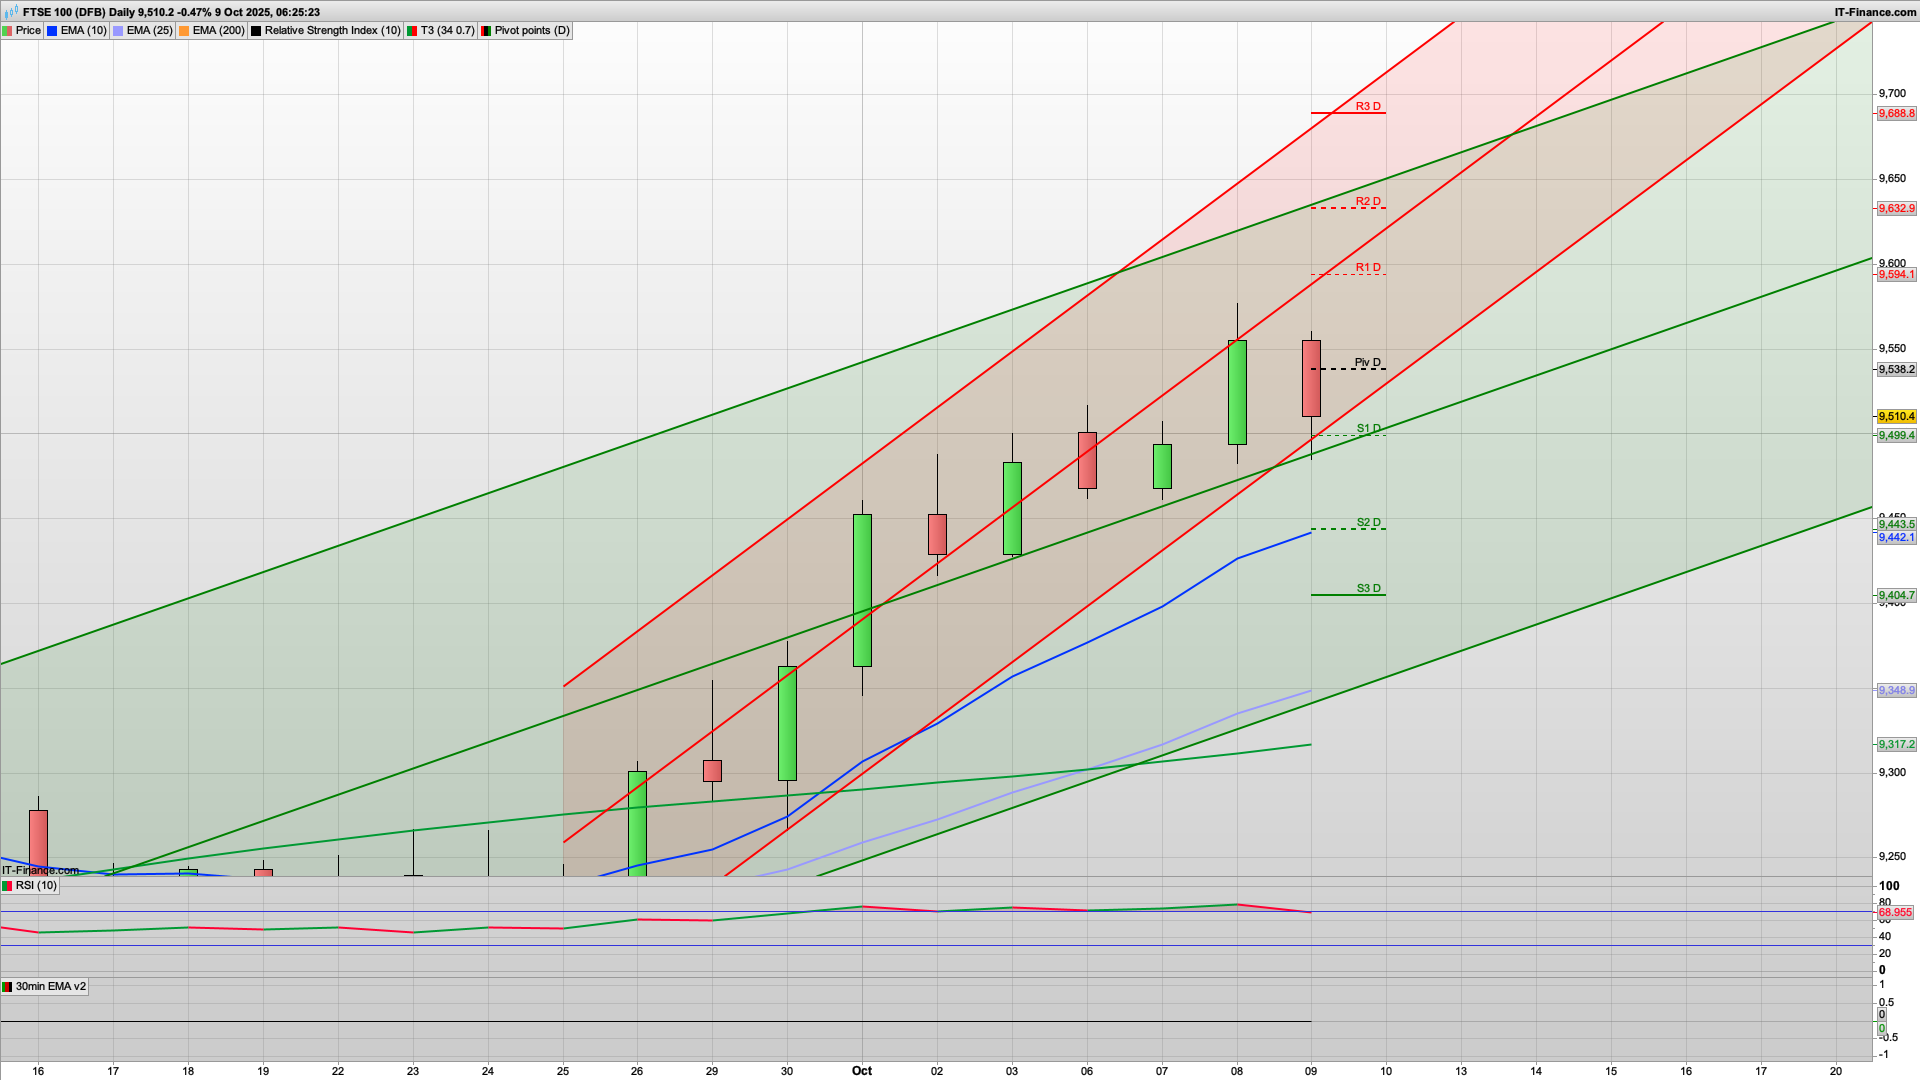
Chart & Indicator Observations
- Price is below EMA(10) and EMA(25) → short-term momentum bearish.
- EMA(200) (orange) sits near 9,500 → important support; a break below could trigger acceleration lower.
- 9,560 overhead resistance; multiple rejections overnight.
- RSI Divergence: RSI hovering near 35–40 → oversold zone approaching → potential for short-term bounce.
- Volume: Recent bearish candles had strong bodies, followed by stabilisation — looks like early consolidation after sell-off.
Bias Assessment
- Intraday Bias: Slightly bearish below 9,560
- Short-term Trend: Still within broader uptrend (daily chart), but correction not yet complete
- Momentum: Weak but stabilising — possible bounce from oversold
For the DAX40 it also looks like an initial rise with the bulls targeting 24720 and the key fib, and also R1 just above this at 24734. If the bears have a go here then a drop down to the 24542 daily pivot would make sense before a bounce back up. Below the daily pivot then look for 24390 key fib. Upside resistance above the 24734 is at 24832.
The S&P500 is looking more bullish with a positive 2h chart and Hull MA support at 6748, which is also just above the daily pivot at 6743 - ergo a long in this area is worth taking for a climb up towards the 6790 key fib level. The bulls will of course be trying for 6800 round number. Below the daily pivot then 6730 is the 30m 200ema, with 6701 key fib below that.
Good luck today.
Interested in how to start trading the FTSE 100? Frequently Asked Questions on Spread betting
Recommended Broker for trading - MT4/5, web and mobile

IC Markets - offers market leading pricing and trading conditions by providing clients with True ECN Connectivity; this allows you to trade on institutional grade liquidity from the world’s leading investment banks, hedge funds and dark pool liquidity execution venues. Highly recommended!
Membership, Trading Tips, Support and Resistance Levels with Live Trading
If you would like more detailed analysis for FTSE 100, DAX40, Gold and the S&P500, including the trades that I am looking to take myself, then please join my active members community.
Keep up to date with new website posts, free sign up below
