
Technical analysis for FTSE 100 for 27th February 2025
The bulls failed to break above 8740 yesterday, and we saw another big dip down to the 8670 level. However the bullish 2h chart has remained so, and we may well see the bulls defend any drop down to the 8700 area again today. Nvidia results were neither here nor there in the end, though the S&P500 has fought back overnight.
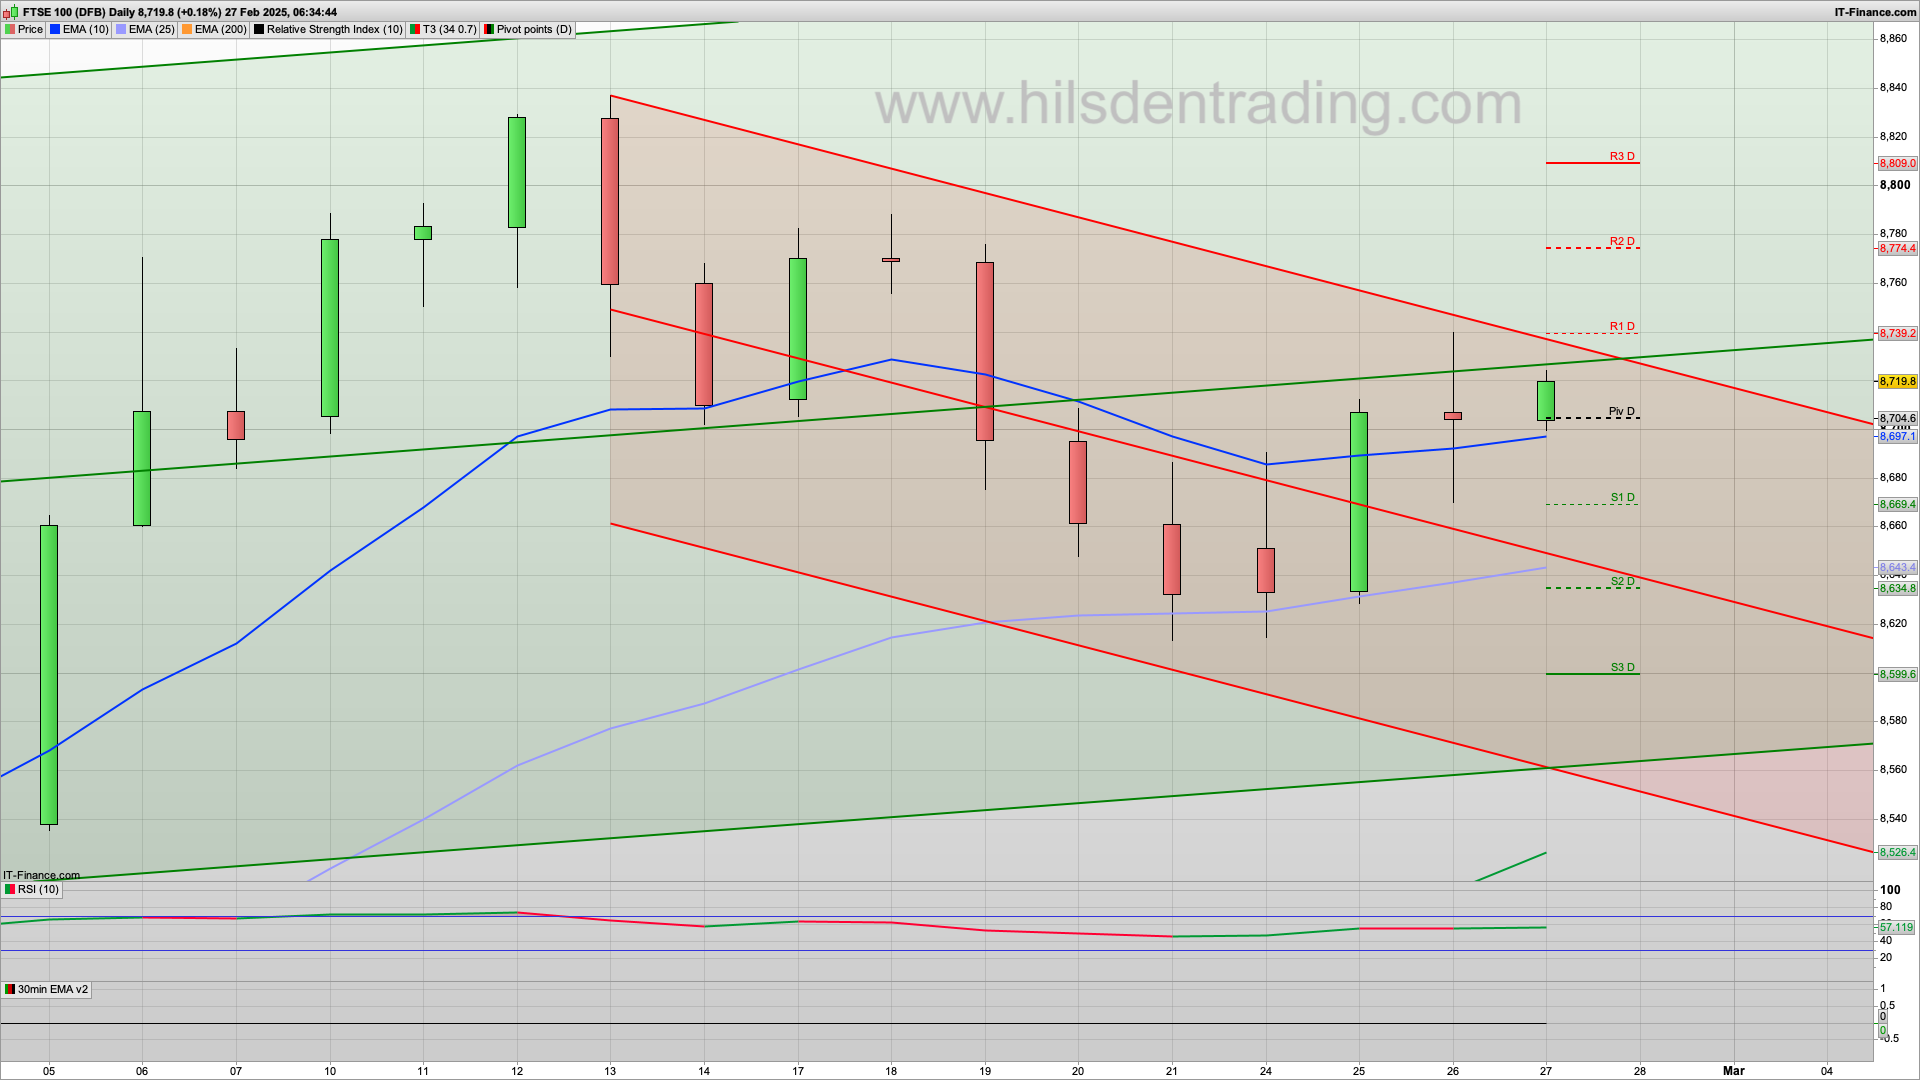
Initially today we will be looking for the daily pivot to hold at the 8704 level to set up a bounce towards the 8740 level again, and with R1 here we may well see the bears have another go at this level. Ultimately today we may well see some more bullishness resume, helped by the US, and a rise towards the 8775 R2 level. 8740 does remain key though as along with R1 we also have the top of the 10d Raff channel here.
If the bears were to break below the daily pivot and the 8695 200ema then 8665 is the green 2h coral line so the next one to look out for, and then 8640 below that as we have both the key fib and the S2 here. 8620 then rears its head again, and a break of that would then likely see a slide to the 8550 level where we should see a decent bounce. Not expecting that low today though! Bear in mind it's the end of the month this week as well, so we may well see some bullish action today and tomorrow.
The US bulls will be keen to push on but we have bearish daily charts now on both the S&P500 and the Nasdaq, with 25ema resistance at the 6036 and 21590 levels respectively. As such a rise to end the month towards these levels whereupon we see some profit taking would make sense over the next two sessions.
The S&P500 bulls will certainly be keen to break above 6000 again but with R1, the key fib and the 200ema 30m all around the 6005 level today we may well see them struggle initially today. The key will be defending the daily pivot at the 5968 level this morning and if they manage to do so then we may well see more upside this afternoon. Even more so if the GDP data out at 13:30 comes in favourably, though the forecast is a drop down to 2.3% from 3.1% previously. On the other hand a drop will help the case for further rate cuts...
The Dax40 will be looking to defend any drop down to the 22525 level and a test of the 30m 200ema and the key fib here would be good for a decent bounce. The 2h chart remains bullish, and 22527 is also the Hull MA support. Below this then 22500 is S1 and then 22440 for the 2h coral. A rise today from the support towards 22826-22846 would be good, if the bulls can be strong enough.
Good luck today.
Interested in how to start trading the FTSE 100? Frequently Asked Questions on Spread betting
Recommended Broker for trading - MT4/5, web and mobile

IC Markets - offers market leading pricing and trading conditions by providing clients with True ECN Connectivity; this allows you to trade on institutional grade liquidity from the world’s leading investment banks, hedge funds and dark pool liquidity execution venues. Highly recommended!
Membership, Trading Tips, Support and Resistance Levels with Live Trading
If you would like more detailed analysis for FTSE 100, DAX, Gold and S&P, including the trades that I am looking to take myself, then please join my active members community.
Keep up to date with new website posts, free sign up below
