
Technical analysis for FTSE 100 for 27th May 2025
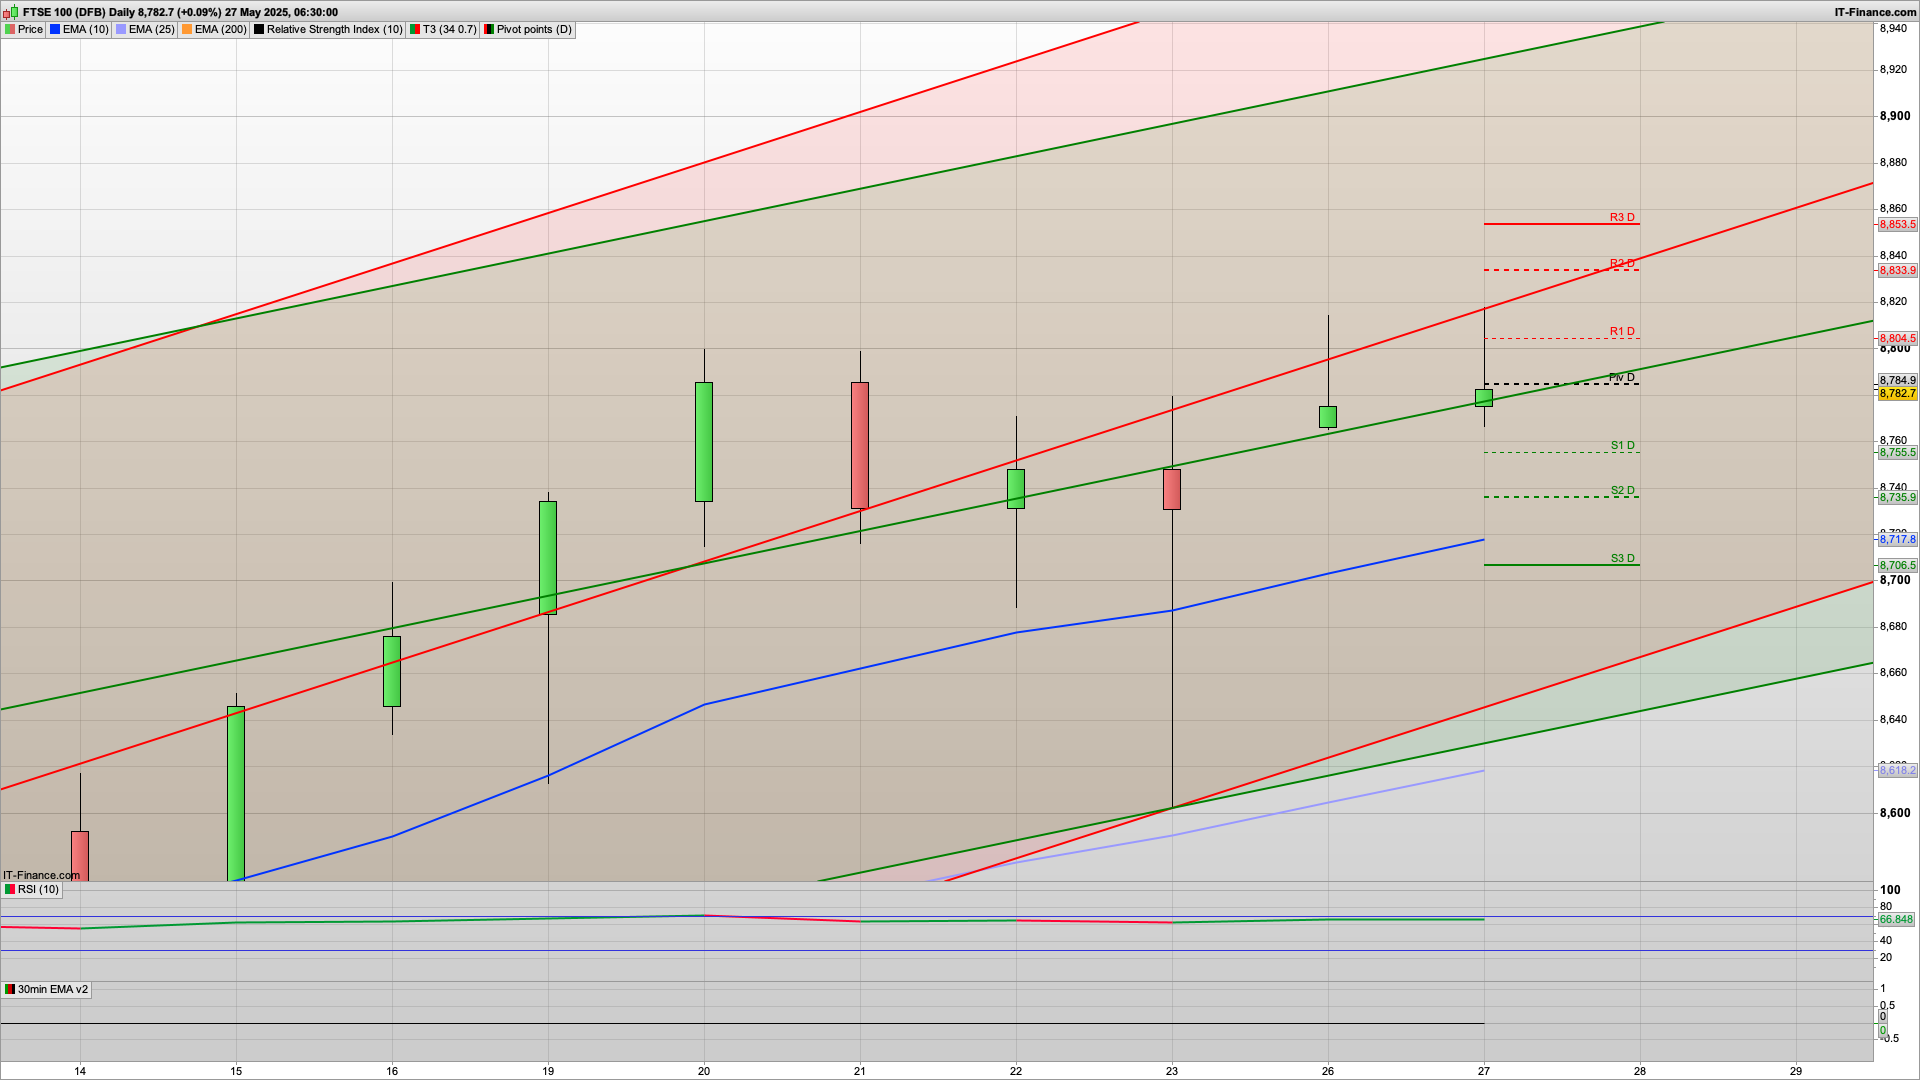
Despite being closed there was a decent enough bull Monday yesterday with the bulls testing the 8812 daily resistance level again. That is the line in the sand for the moment that they will need to break now for a push towards the 8900 level. 8805 is also R1 to start with today, and it does feel like a dip and rise sort of day, as the 2h chart remains bullish with decent support at the 8771 level to start with.
That said we may well see an overshoot of that and a drop down to the 8755 area where we have S1, and also the 200ema on the 30m chart, and I feel that a long here is worth taking. The bulls will be keen to break 8815ish this week and I am still expecting a test of 8900 soon
Should it go lower today though and we get a bear Tuesday play out, then a test of the key fib at 8730 and just below 8735 S2 may well materialise.
With the daily chart still looking bullish with rising Raff channels and a hold of the near enough test of the 25ema at 8600 on Friday, the sentiment remains bullish for the moment so we are still in buy the dip mode on the longer timeframes.
It will be interesting to see if they defend the 8771 or the 8750 today though and therefore keep an eye on both these and longs off both make sense.
Above the 8812 resistance level then the bulls will be aiming for the 8833 R2 initially, and ultimately the 8853 R3 level. This may well be possible later on, especially if we get US help but stand by for another random Trump announcement having rowed back on his 50% EU tariffs!
If we did see 8850 today then a short here is worth taking as well.
No massively major news today, just USA CB consumer confidence at 1500 which may lead to a little bit of volatility then.
The Dax40 also has a bullish 2h chart with support at 23951, and the daily pivot at 23933, along with the 30m 200ema here. As such should we get a dip down to this level then a bounce here fits well and we may well see a dip and rise play out on this.
It's a similar picture for the S&P500 as well with Hull MA support at 5826 on the 2h chart, and 5829 for S3. Should we dip this low then a long here is viable, and we may well see some more bullishness to close out the month.
Good luck today.
Interested in how to start trading the FTSE 100? Frequently Asked Questions on Spread betting
Recommended Broker for trading - MT4/5, web and mobile

IC Markets - offers market leading pricing and trading conditions by providing clients with True ECN Connectivity; this allows you to trade on institutional grade liquidity from the world’s leading investment banks, hedge funds and dark pool liquidity execution venues. Highly recommended!
Membership, Trading Tips, Support and Resistance Levels with Live Trading
If you would like more detailed analysis for FTSE 100, DAX, Gold and S&P, including the trades that I am looking to take myself, then please join my active members community.
Keep up to date with new website posts, free sign up below
