
Technical analysis for 12th March 2026
FTSE 100 — Bearish correction
- Structure
- Downward corrective channel
- Price still below pivot
- EMAs pointing lower
- Lower highs structure intact
- Recent candles show weak stabilization only.
- Bias: Sell rallies
DAX — Bearish continuation
- Structure
- Price still inside a strong descending channel
- Trading below pivot
- EMAs clearly trending down
- Lower highs and lower lows structure intact
- The recent small candles show weak consolidation after the selloff, not reversal.
- Bias: Sell rallies
- Resistance zones likely around
- Pivot → R1 → channel midline
NASDAQ — Neutral / range
- Structure
- Market rebounded strongly from major support
- Now consolidating around pivot
- EMAs flattening
- This suggests short-term equilibrium rather than trend.
- Bias: Range / slight bullish recovery
- Bullish scenario if pivot holds as support.
S&P 500 — Bearish trend still dominant
- Structure
- Downward channel still intact
- Price holding below pivot
- EMAs sloping down
- Recent bounce failing near resistance
- Momentum remains weak.
- Bias: Sell strength
GOLD — Bullish trend intact
- Structure
- Price inside ascending channel
- Higher lows structure intact
- Trading around pivot / EMA support
- Momentum remains positive overall.
- Bias: Buy pullbacks
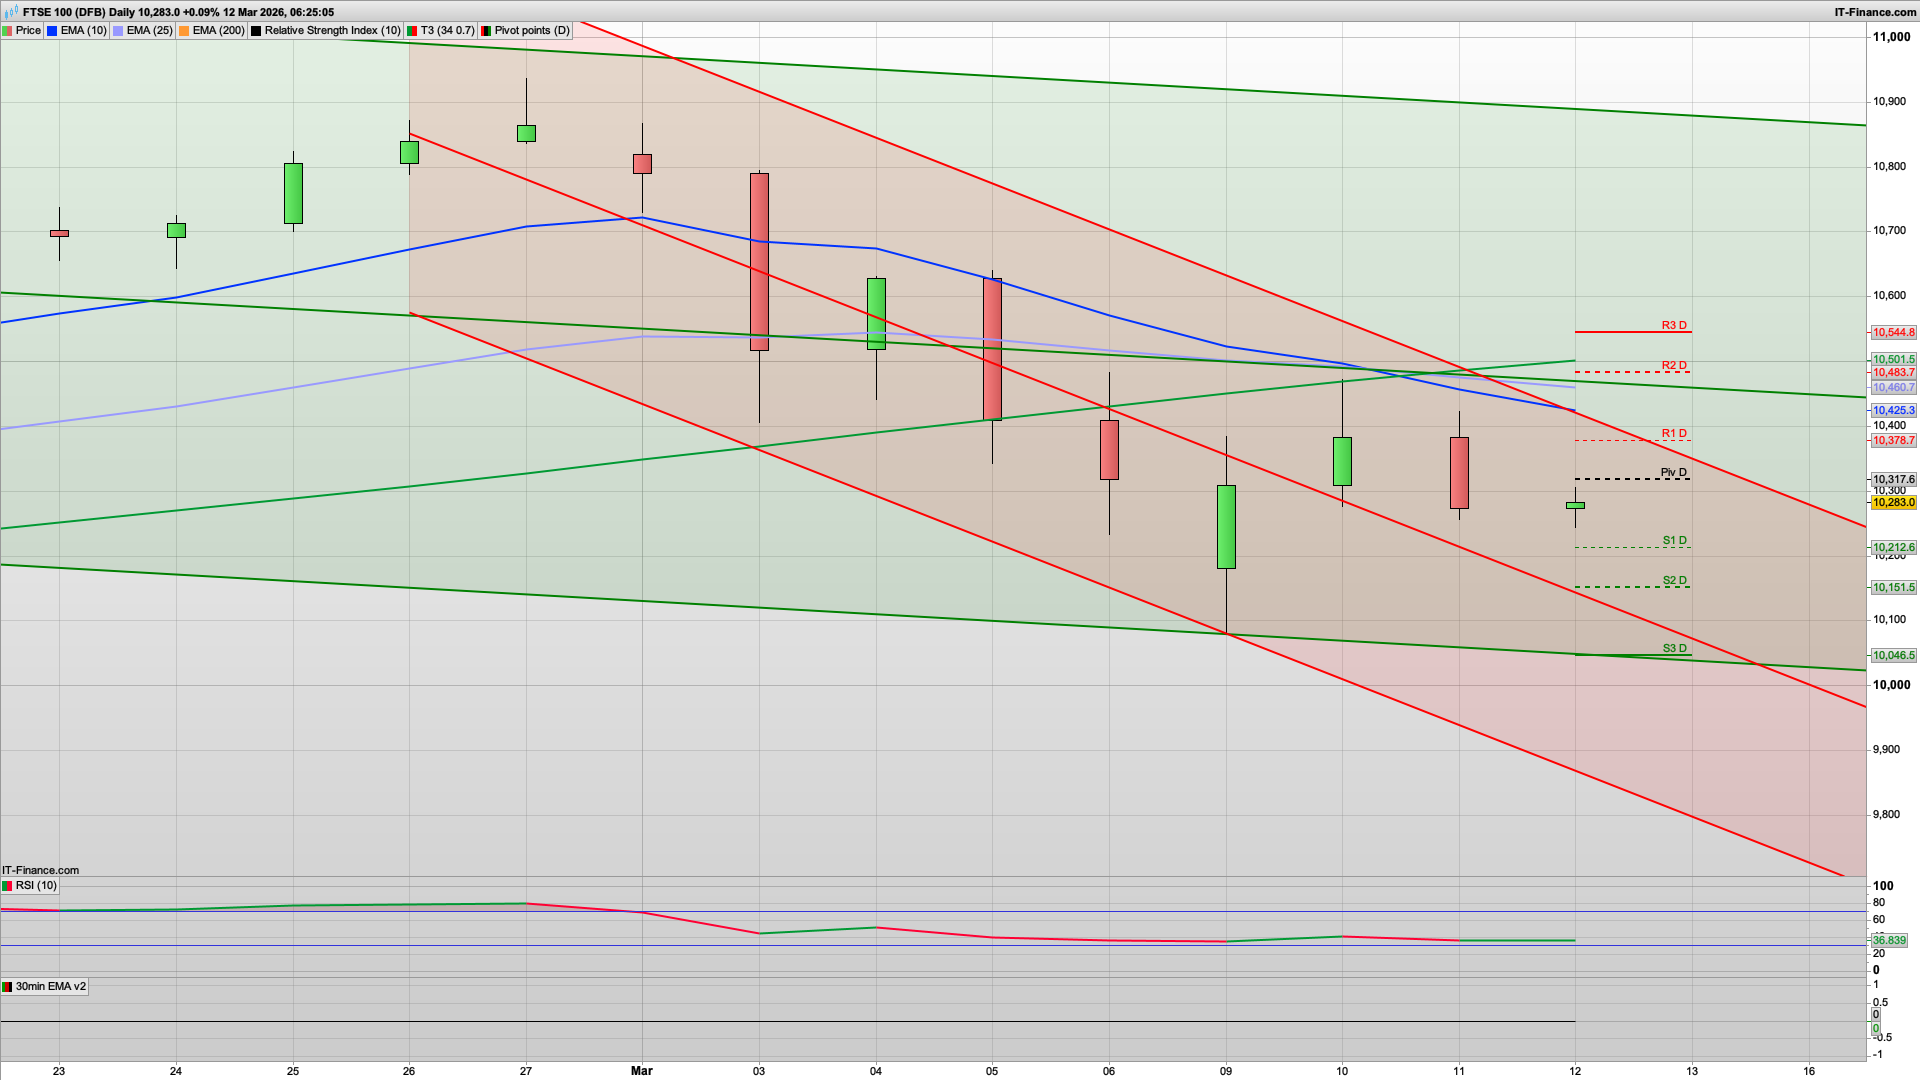
The 10250 support level from yesterday has held overnight and may well hold again for an initial bounce towards the daily pivot at 10317 this morning. We also have the key fib at 10238 to start with, and this area has held overnight as decent support. An initial dip down/stop hunt/flush may well play out to start with, before the bulls try and push towards that resistance level.
Oil prices have spiked higher again but have since dropped back to the $90 level, which will help settle a few nerves to start with. The FTSE100 2h chart is also still weakly bullish to start with today, and the coral remains green, also showing 10250 support.
If the bulls were to break above the 10317 daily pivot level then a push towards the 10360 200ema (30m) is likely. Also note that the daily chart is locked in bearish now with 25ema resistance at the 10460 level so any significant rally towards this area is likely to see shorts load up around here.
Thats said I am more inclined to go with the daily pivot holding as resistance this morning.
For the bears, if they break below the 10240 level then a drop down to S1 at 10212 is likely, with the 10151 S2 level below that. The 10212 level is likely to be defended by the bulls though so we may well see a decent bounce here.
Once again, movement is going to be driven by news, fear and greed, so continue to stay nimble.
Good luck today.
Interested in how to start trading the FTSE 100? Frequently Asked Questions on Spread betting
Recommended Broker for trading - MT4/5, web and mobile

IC Markets - offers market leading pricing and trading conditions by providing clients with True ECN Connectivity; this allows you to trade on institutional grade liquidity from the world’s leading investment banks, hedge funds and dark pool liquidity execution venues. Highly recommended!
Join my Membership for Trading Tips, Support and Resistance Levels with Live Trading
If you would like more detailed analysis for FTSE 100, DAX40, Gold and the S&P500, including the trades that I am looking to take myself, then please join my active members community.
Keep up to date with new website posts, free sign up below
