
Technical analysis for 31st March 2026
FTSE 100 — Neutral → Slight bullish pullback
- What changed
- Multiple green candles building
- Price now above pivot
- Testing EMA resistance from below
- This is the strongest index right now.
- Short term: bullish pullback
- Higher timeframe: still bearish trend
- Bias:
- Intraday: Buy dips
- Higher timeframe: Sell resistance
DAX — Bearish → Pullback into resistance
- What changed
- Strong green candle, but still inside bearish channel
- Price now pushing into pivot + EMA resistance zone
- No break of structure (still lower highs)
- Read: This is a corrective bounce, not reversal.
- Bias: Sell rallies (key area = pivot / EMA zone above)
NASDAQ — Bearish (weak consolidation)
- What changed
- Small indecision candle after heavy selling
- Still below pivot + below falling EMAs
- No bullish structure shift
- Read: Market is pausing, not reversing
- Bias: Sell rallies
S&P 500 — Bearish continuation
- What changed
- Small bounce but failed to reclaim pivot
- Strong prior bearish momentum still dominant
- Lower high confirmed
- Bias: Sell rallies
GOLD — Bullish pullback continuation
- What changed
- Strong follow-through green candle
- Holding above pivot
- Momentum improving
- Read: Clear short-term strength vs indices
- Bias: Buy dips
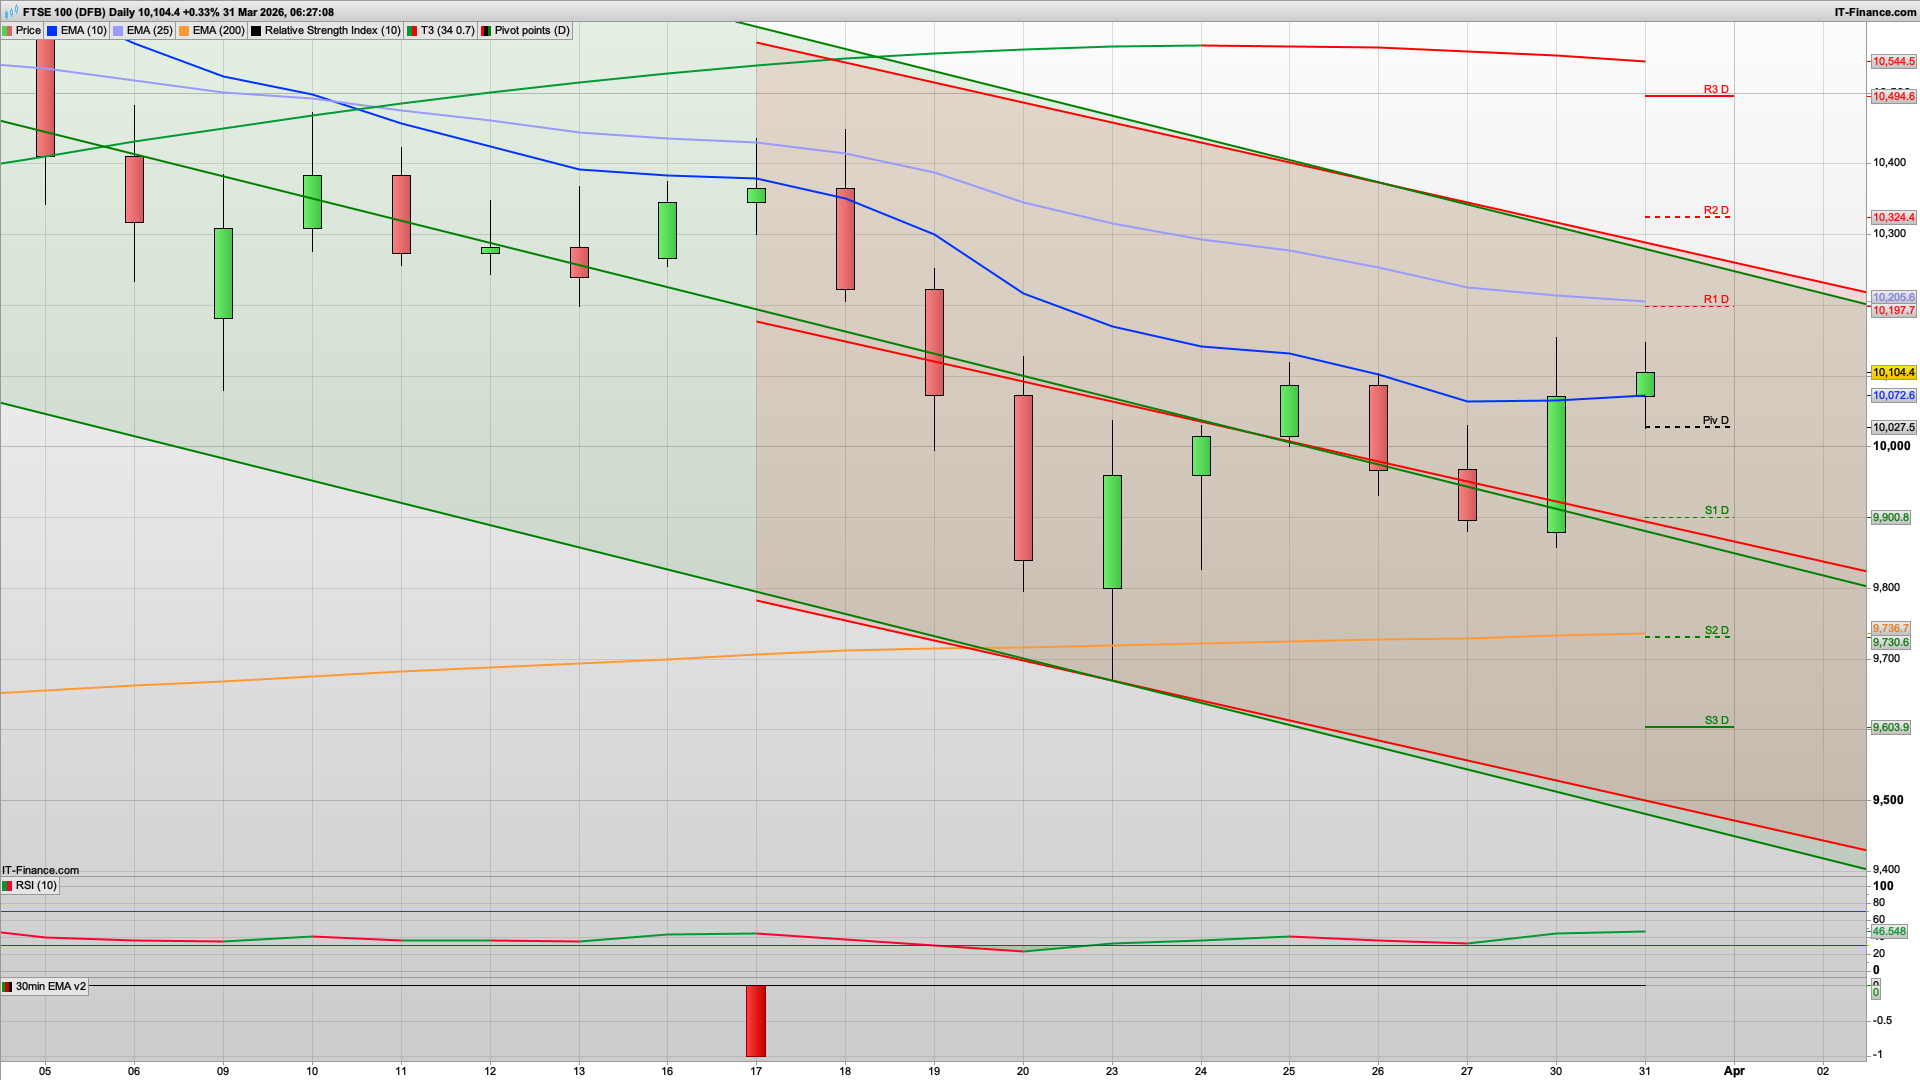
After dropping off the 10150 level to a low of 10020 it looked like we would be on track for a bear Tuesday to end the month, however once again a positive Trump news element has seen futures bounce again and in turn the FTSE100 looks positive for today, with a potential rise to test the key 10197 level.
Initially I am thinking that we see a small drop down to test the daily pivot and 10027 and we also have the 30m 200ema here as well as it being the overnight low. If this holds then we should see a decent climb before some month end profit taking later on. The 2h chart is also bullish now, with the 10025 level as support from the Hull MA, along with a green coral at 9975 below that. 9965 is also the key fib.
That said, I would like to see any retest of the 10025 level hold and a decent rise and dip play out. The S&P500 will be keen to rise as well to build on its overnight bounce from 6315. The key there will be breaking the 6400 level for further upside.
If the bulls were to break 10200 then (and bear in mind we also have 10191 as daily resistance) then the next key level to look for is 10236 and then 10280 which is the top of the Raff channels. Might be a rather big ask to get that high unless there's a sudden ceasefire!
Q4 UK GDP data has just been released coming in at 0.1% again. So almost a rounding error and the economy still flatlining.
Good luck today.
Interested in how to start trading the FTSE 100? Frequently Asked Questions on Spread betting
Recommended Broker for trading - MT4/5, web and mobile

IC Markets - offers market leading pricing and trading conditions by providing clients with True ECN Connectivity; this allows you to trade on institutional grade liquidity from the world’s leading investment banks, hedge funds and dark pool liquidity execution venues. Highly recommended!
Join my Membership for Trading Tips, Support and Resistance Levels with Live Trading
If you would like more detailed analysis for FTSE 100, DAX40, Gold and the S&P500, including the trades that I am looking to take myself, then please join my active members community.
Keep up to date with new website posts, free sign up below
