
Technical analysis for FTSE 100 for 25th September 2025
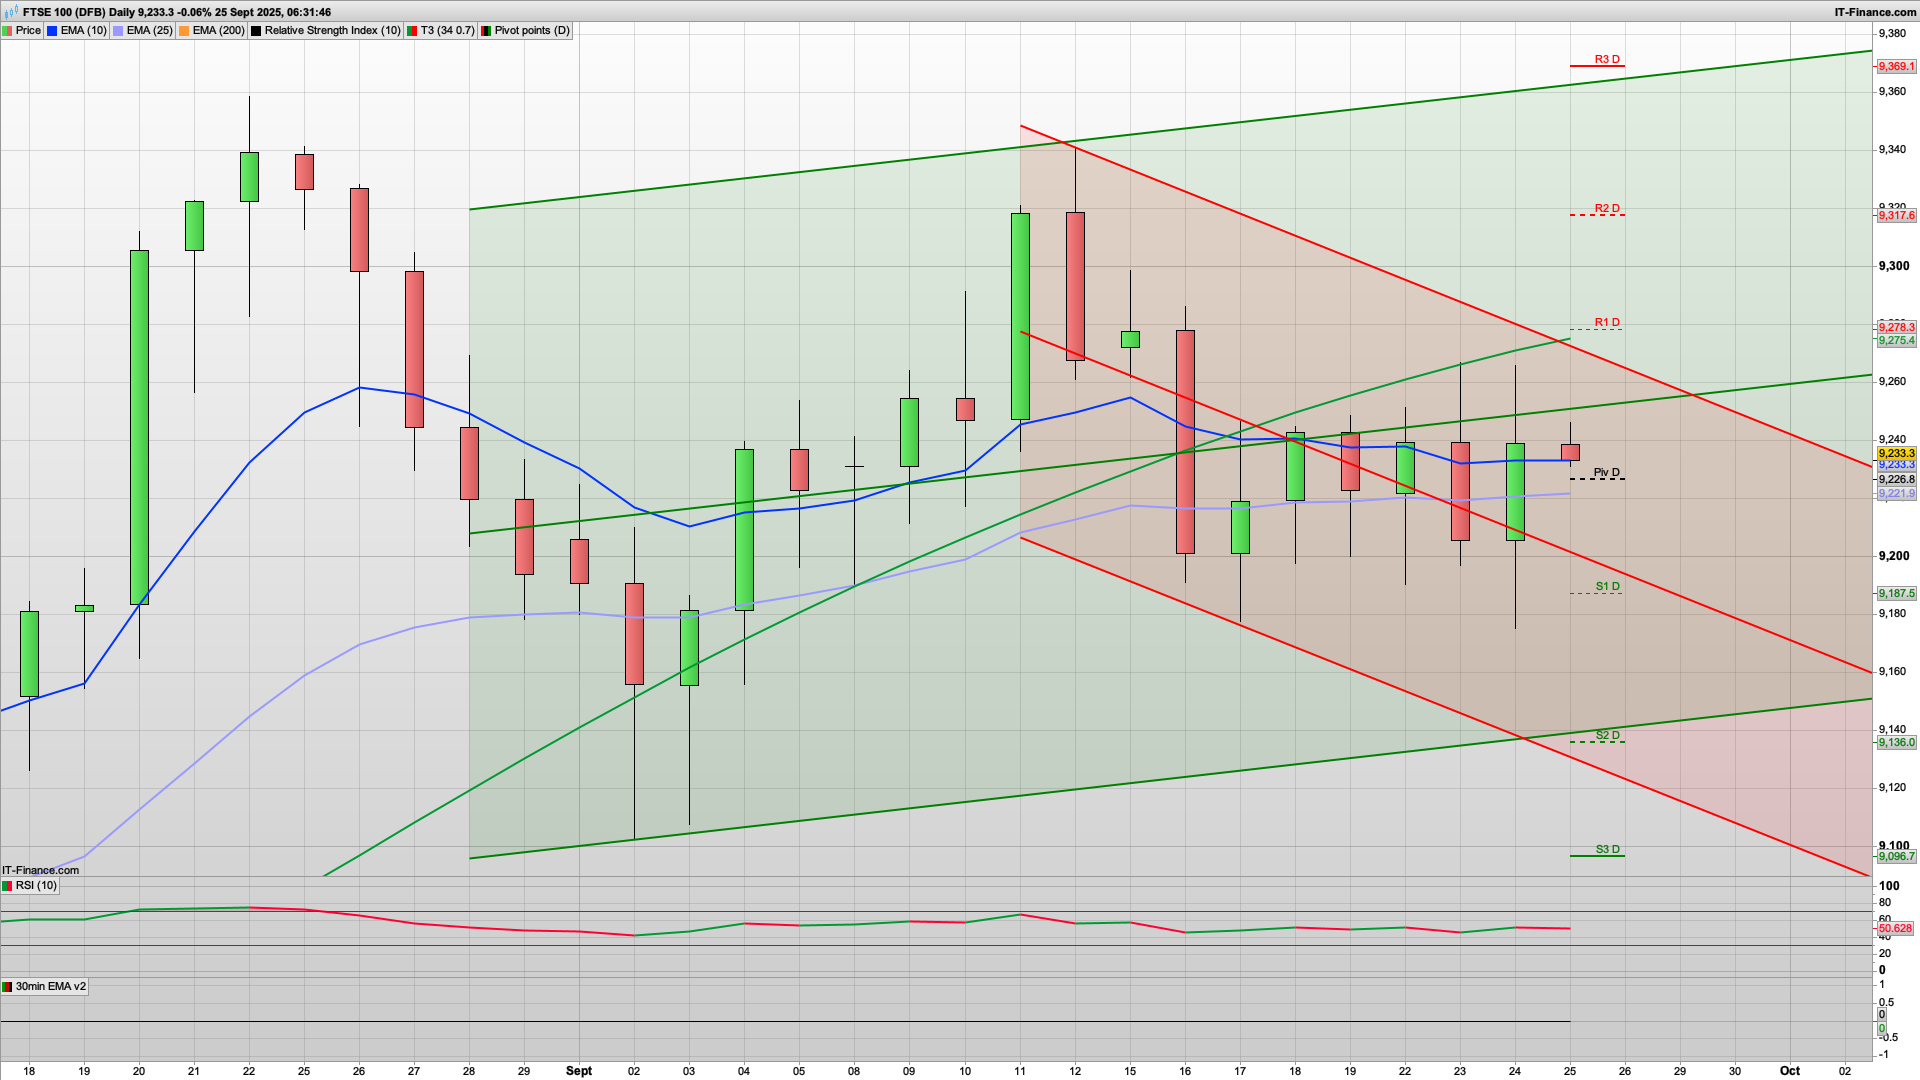
A good rebound from the 9180 area yesterday as the bears failed to break below the 9190 level with conviction to get it to 9160 being the next daily support (a failed breakdown set up) and the bulls regained control to put in a climb towards the 9260 level again. However, that remains as resistance as it has done all week, though if they manage to break above that today then I am still looking for a test of the 9290 area where we have daily resistance. We also have the key fib level for today at 9293 to lend some weight to this level so it will be worth shorting any rise that manages to get this far.
Above the 9290 area then look for the 9317 R2 level, with the 20d Raff above that currently at 9360. That is probably a bit optimistic for today though, but note that the 20d Raff channel has resumed its upwards trend now (the 10d Raff is still heading down though). The 2h chart is also bullish for today with support at 9230.
Talking of support, assisting that 9230 area are the daily pivot, 30m coral and the 200ema. As such, I would like to see the bulls spring up off this today, as a break of that will likely see a retest of 9180 being yesterdays low, and then 9169 key fib just below that. 9162 is also the lower daily support level of note so should it get bearish then look for a hold around this area. The bears however will be a bit hesitant today after losing that battle yesterday.
Overnight we have hovered around the daily pivot level so no particular bias as yet, but I feel that the bulls might be quick out the blocks today. The ASX200 had a decent bull run today so we may well follow suit.
There isnt any major UK certtnric news due, but we do have the US GDP Q2 and Initial Jobless Claims out at 1330 so expect some volatility then.
For the S&P500 it looks a bit more bearish as the 2h chart has resistance at 6677 from both the Hull MA and the coral, and R1 at 6674 so should we see a rise to this area then the bears may well try here. The 30m chart is also bearish to start with and its possible it drops down to test yesterdays low at 6622, where we also have the S1 level. If we do get a dip initially then worth a long at this area and its looking that could be the range, at least prior to the news releases - 6622-6677. Lower down then look for a round number test at 6600 which is just above the S2 level of 6597 but also the key fib, so it would be good to see that hold if tested. At least initially!
For the DAX40 I am thinking a rise towards the 23815 level, if the bulls can defend the 2h Hull MA support at 23633. That is just below the daily pivot at 23647, and just above the 30m 200ema at 23621 so it would be good to see this hold for the bulls to at least attempt to build on that bounce back yesterday.
Good luck today.
Interested in how to start trading the FTSE 100? Frequently Asked Questions on Spread betting
Recommended Broker for trading - MT4/5, web and mobile

IC Markets - offers market leading pricing and trading conditions by providing clients with True ECN Connectivity; this allows you to trade on institutional grade liquidity from the world’s leading investment banks, hedge funds and dark pool liquidity execution venues. Highly recommended!
Membership, Trading Tips, Support and Resistance Levels with Live Trading
If you would like more detailed analysis for FTSE 100, DAX40, Gold and the S&P500, including the trades that I am looking to take myself, then please join my active members community.
Keep up to date with new website posts, free sign up below
