
Technical analysis for FTSE 100 for 8th September 2025
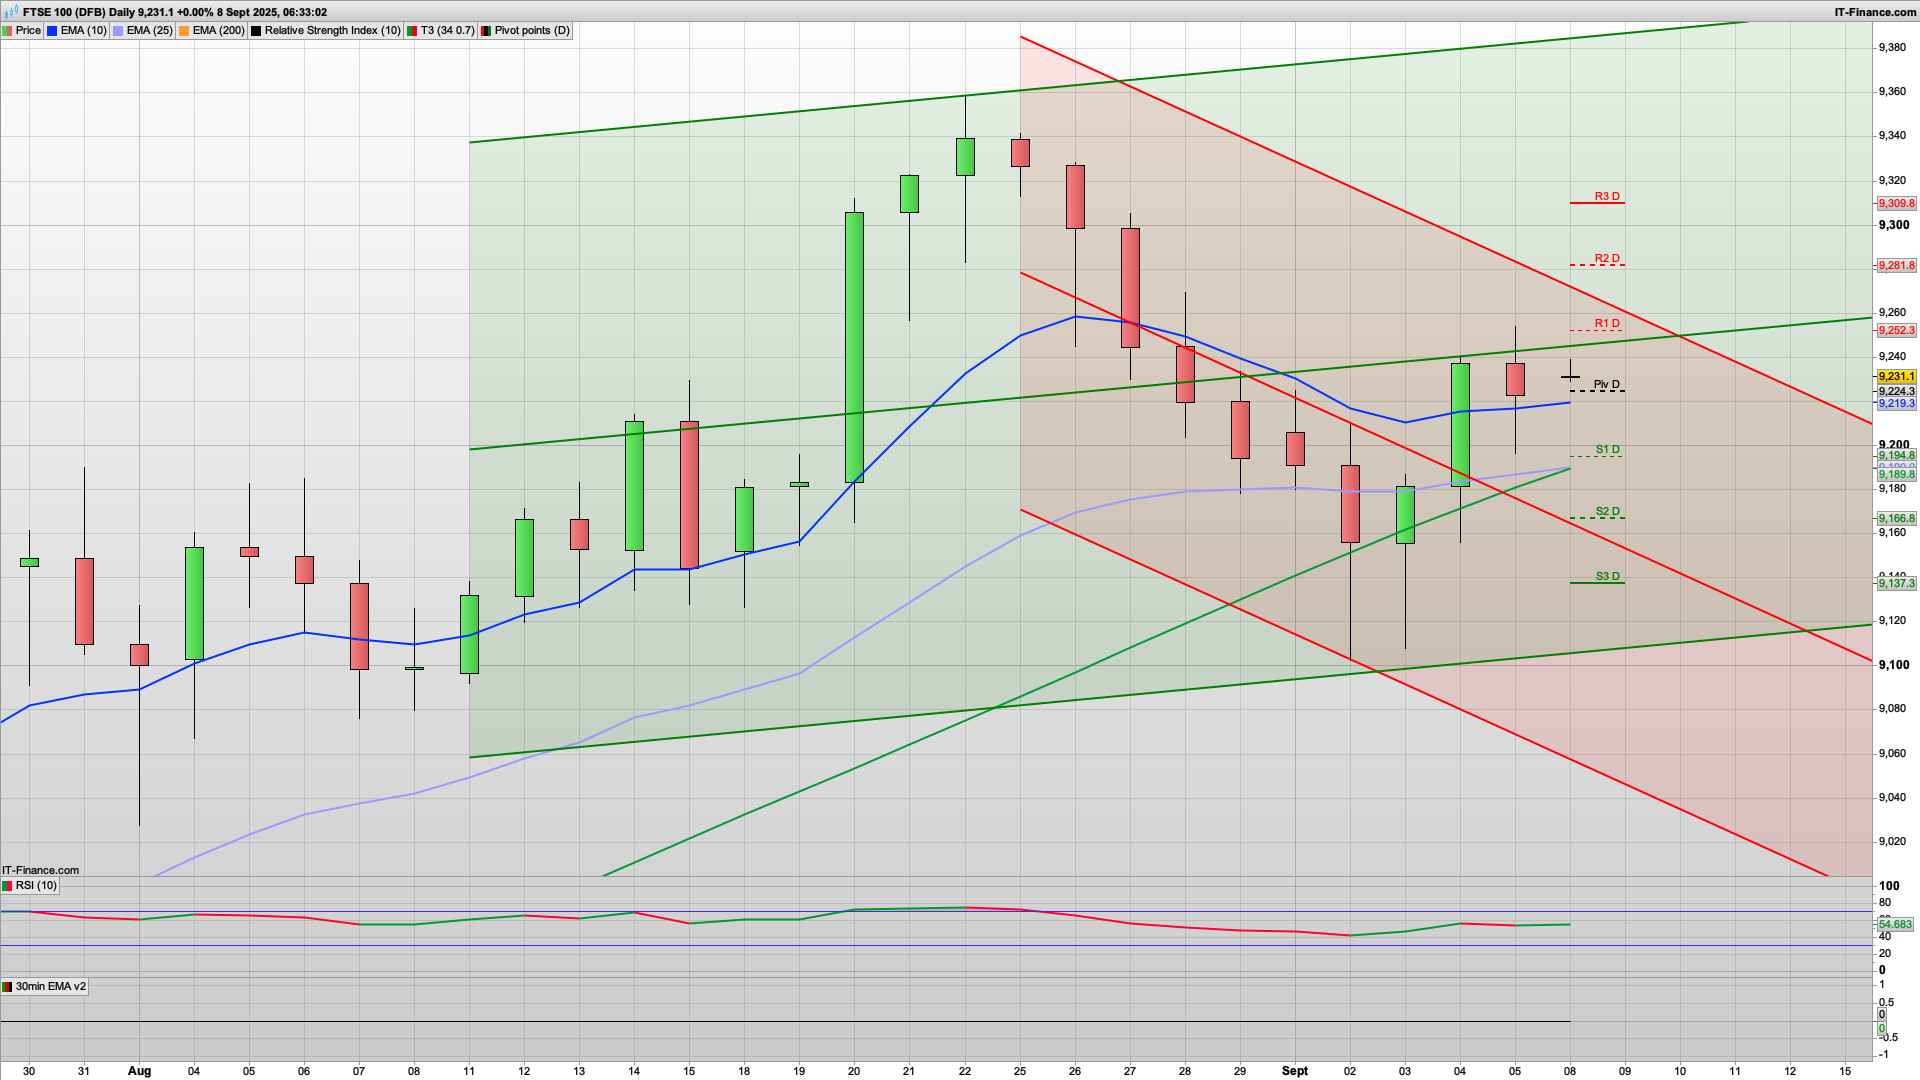
The scene looks set for another bull Monday but the bulls will need to break above the 9250 level as that remains the line in the sand, being the recent high and R1 for today. If they manage to do that, and I am thinking that they will, then a rise to test the 9280 resistance level looks likely, but I am thinking that we will likely see the bears appear here, and a subsequent drop. 9270 is the key fib, 9281 is the R2, and the daily resistance is also at 9281 so it should in theory get a decent reaction. Ergo a rise and dip looks likely.
If the bulls were to break above the 9282 level then it keeps a test of the recent high at 9337 on the table, which may happen today, though in the absence of any significant news is more likely later in the week. I still remain bullish overall on the longer time frames and buying dips for longer holds is still working well.
Support wise, then 9210 is first up, and the 30m 200ema there, and just above 9194 S1. That level held well on Friday and we got a decent enough bounce out of it which has kept the 2h chart bullish. 9210 is the Hull MA as support for that to also give some credence to this level - as such I would like to see any drop down to test this level hold. If the bears were to break S1 at 9194, then a slide down to the 9166 S2 is next up. That is also in a fairly decent support zone so should see a bounce.
Generally thinking a bullish Monday though and a rise and dip.
We may well see that pattern play out on both the DAX40 and the S&P500 as well. For the DAX40, resistance is at the 23843 level where we have R1 and also just above that we have the key fib at 23851. As such a short here for a drop back down to the daily pivot at 23694 would fit the chart well. Lower support is at the 23534 level where we have the fib supporting level. 23494 S1 just below that. The 2h chart remains bullish, though the daily is bearish. Support from the 2h coral (now green) is at the 23643 level.
For the S&P500 we are still playing out the bounce from the 2h coral at 6445 on Friday, and that may well see a rise towards the 6529 level where we have the key fib and just above the 6526 R1 level. As such some profit taking for a drop back down to the 6484 daily pivot, and possibly down to the 6440 area could materialise. 6440 is the S1 and key fib. Above 6530 (and bear in mind that this was also Fridays high (so a tough nut to crack in the short term) then 6574 is R2 and also just below the top of both the 10&20 day Raff channels.
Good luck today.
Interested in how to start trading the FTSE 100? Frequently Asked Questions on Spread betting
Recommended Broker for trading - MT4/5, web and mobile

IC Markets - offers market leading pricing and trading conditions by providing clients with True ECN Connectivity; this allows you to trade on institutional grade liquidity from the world’s leading investment banks, hedge funds and dark pool liquidity execution venues. Highly recommended!
Membership, Trading Tips, Support and Resistance Levels with Live Trading
If you would like more detailed analysis for FTSE 100, DAX40, Gold and the S&P500, including the trades that I am looking to take myself, then please join my active members community.
Keep up to date with new website posts, free sign up below
