
Technical analysis for 20th July 2026
We begin the new trading week with the markets facing another significant test. Over the weekend the conflict between the US and Iran intensified once again, pushing Brent crude above the $90 per barrel mark for the first time in over a month. That immediately puts inflation back into the spotlight.
Only a few days ago the market was celebrating softer US inflation data and becoming increasingly confident that the Federal Reserve would remain on hold. This morning the conversation has changed. Higher oil prices have pushed Treasury yields above 5%, the US Dollar is strengthening again and traders are beginning to price in another Federal Reserve rate increase before the end of the year.
At the same time we have one of the biggest weeks of the earnings season ahead, with several of the world's largest technology companies due to report. After the recent correction in semiconductor shares, those earnings could determine whether the AI-led rally resumes or whether investors continue taking profits.
For today I expect a cautious start rather than a panic sell-off. Markets still have strong underlying trends, but they now need corporate earnings to justify current valuations.
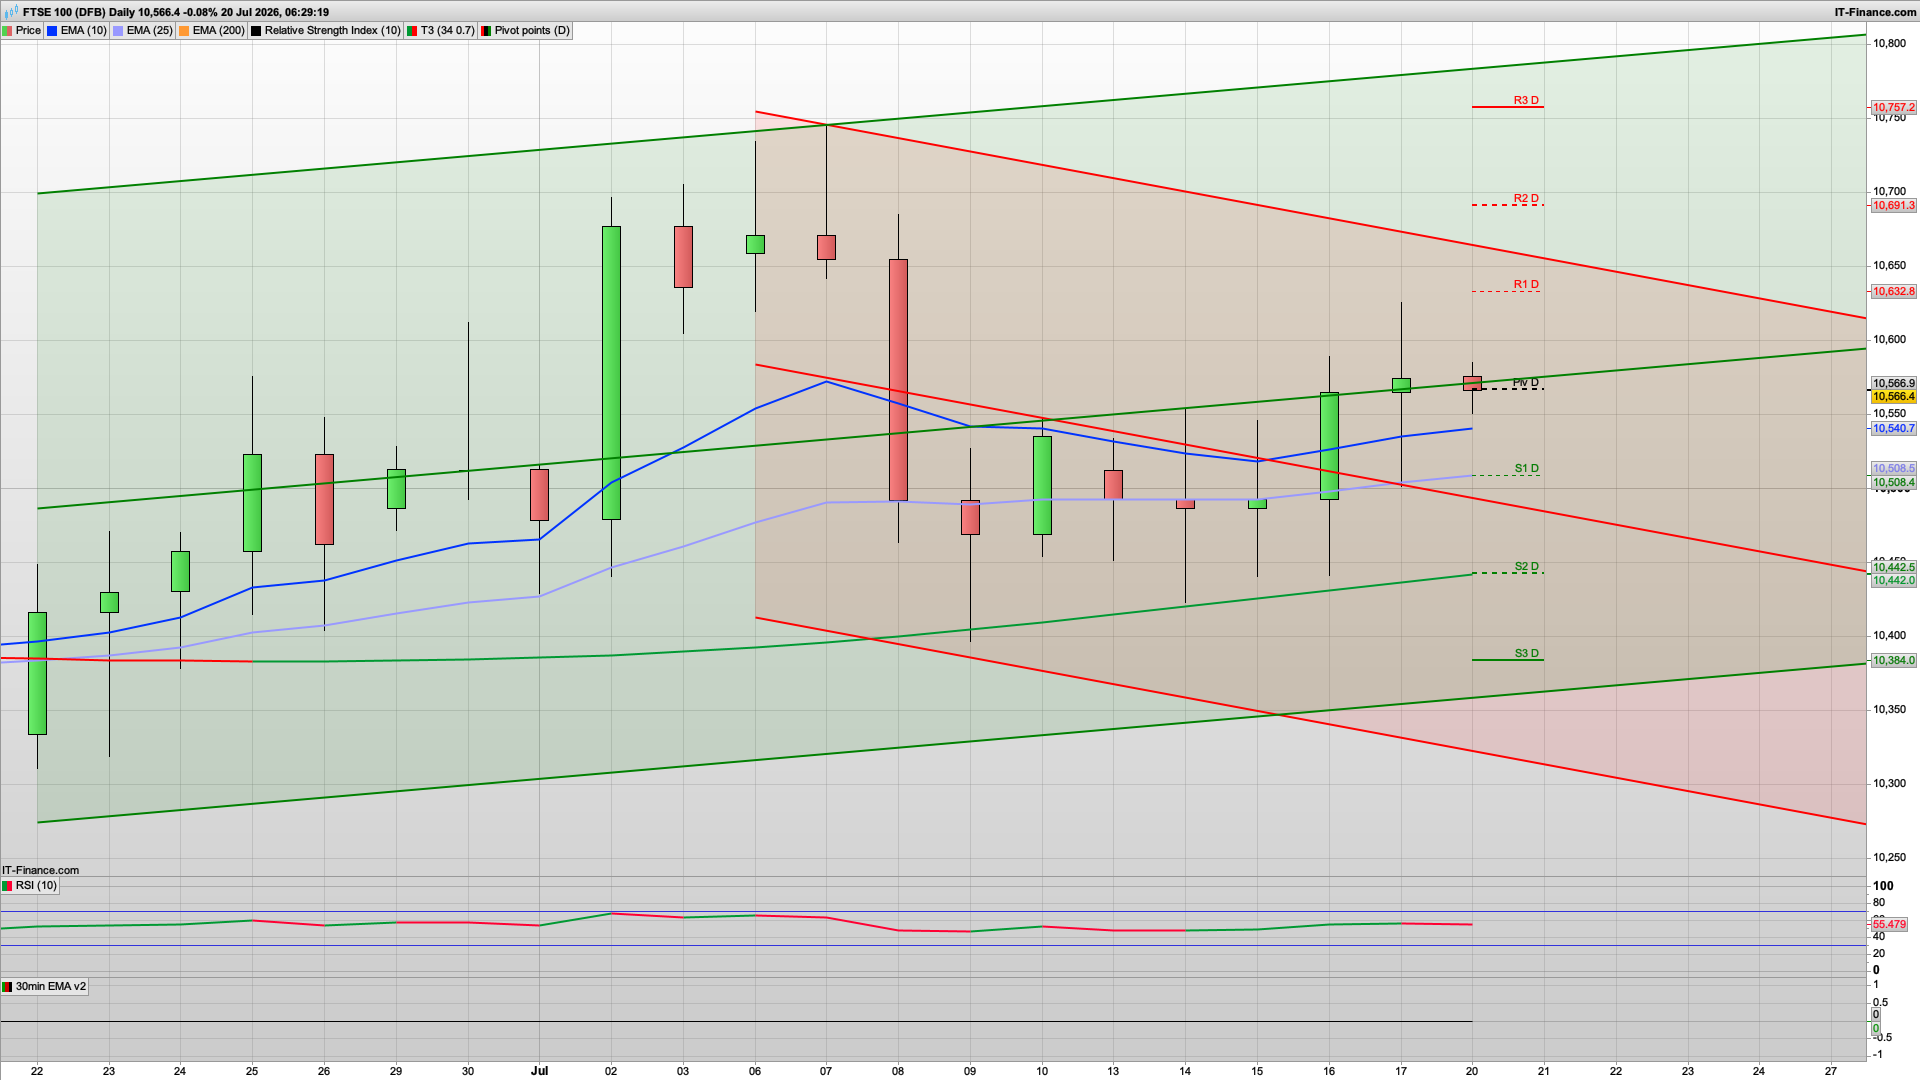
FTSE 100 - Bullish
- The FTSE has improved materially compared with Friday.
- Price has:
- Reclaimed the Pivot.
- Moved back above the 10 EMA.
- Held comfortably above the 200 EMA.
- Broken the sequence of lower closes.
- The index is showing relative strength versus the DAX and Nasdaq.
- Bias: Bullish.
- Buying pullbacks towards the Pivot or EMA support looks preferable while price holds above 10,550.
DAX 40 - Bearish
- The DAX remains the weakest European index.
- Technically:
- Still trading below the 10 and 25 EMA.
- Price remains inside the falling channel.
- Trading below the Daily Pivot.
- Lower highs and lower lows remain intact.
- Bias: Bearish.
- Selling rallies into the daily EMA zone remains the higher-probability setup.
S&P 500 - Neutral
- The S&P remains structurally healthier than the Nasdaq.
- Positives:
- Still above the 200 EMA.
- Long-term rising channel remains intact.
- Negatives:
- Closed below the Pivot.
- Short-term momentum has weakened after last week's sell-off.
- Bias: Neutral.
- The market needs to reclaim the Pivot before the bulls regain control. Until then, expect two-way price action.
Nasdaq 100 - Bearish
- The Nasdaq continues to show the weakest momentum.
- Although Friday's selling has slowed, price remains:
- Below both moving averages.
- Inside a clear short-term downtrend.
- Bias: Bearish.
- Unless buyers reclaim 28,900–29,150, rallies are likely to attract selling.
Gold - Neutral (Longer-term Bearish)
- Gold has produced a modest recovery candle after several sessions of selling.
- Positives:
- Buyers defended support near 3,980.
- Small bullish candle suggests selling pressure is easing.
- Negatives:
- Still below the 10 EMA.
- Still below the 25 EMA.
- Still inside the falling channel.
- Bias: Neutral, with a bearish longer-term trend.
- A daily close above the Pivot and EMA10 would strengthen the recovery. Until then, this looks more like a bounce than a confirmed reversal.
Today's charts suggest a mixed market rather than broad risk-off. The FTSE is beginning to outperform and offers the strongest long setup, while the Nasdaq and DAX continue to lag and remain the preferred indices for short opportunities on rallies. Gold is showing early signs of stabilisation but needs a break back above its pivot and short-term moving averages before a sustained bullish bias is warranted.
FTSE 100 Analysis
The FTSE remains the strongest of the major European indices. The reason is straightforward. Higher oil prices continue to support the heavyweight energy companies that make up a significant proportion of the index. Shell and BP should remain well supported while crude trades above $90, helping offset weakness in other sectors. However, if bond yields continue climbing, financial conditions will tighten and that may eventually limit further gains.
- What I'm Watching
- Whether buyers defend Friday's support levels.
- Performance of the energy sector during the European session.
- Whether banks continue outperforming on higher yields.
- Trading Plan
- I still favour buying controlled pullbacks while support holds.
- If we see an early dip followed by higher lows developing on the intraday charts, I think the FTSE has the potential to outperform again.
- A break below Friday's low would weaken the bullish outlook and suggest a deeper retracement is developing.
Interested in how to start trading the FTSE 100? Frequently Asked Questions on Spread betting
Recommended Broker for trading - MT4/5, web and mobile

IC Markets - offers market leading pricing and trading conditions by providing clients with True ECN Connectivity; this allows you to trade on institutional grade liquidity from the world’s leading investment banks, hedge funds and dark pool liquidity execution venues. Highly recommended!
Join my Membership for Trading Tips, Support and Resistance Levels with Live Trading
If you would like more detailed analysis for FTSE 100, DAX40, Gold and the S&P500, including the trades that I am looking to take myself, then please join my active members community.
Keep up to date with new website posts, free sign up below