
Technical analysis for FTSE 100 for 17th March 2025
After the bullishness on Friday across the board we may well see a bit of consolidation today and a rise and dip play out. The FTSE100 2h chart remains bullish and the bulls will be aiming to crack the 8700 level sooner rather than later if they can keep the momentum. There is a chance of a rise to test the 8716 R1 level this morning, but it will depend on the daily pivot support holding at 8627 initially.
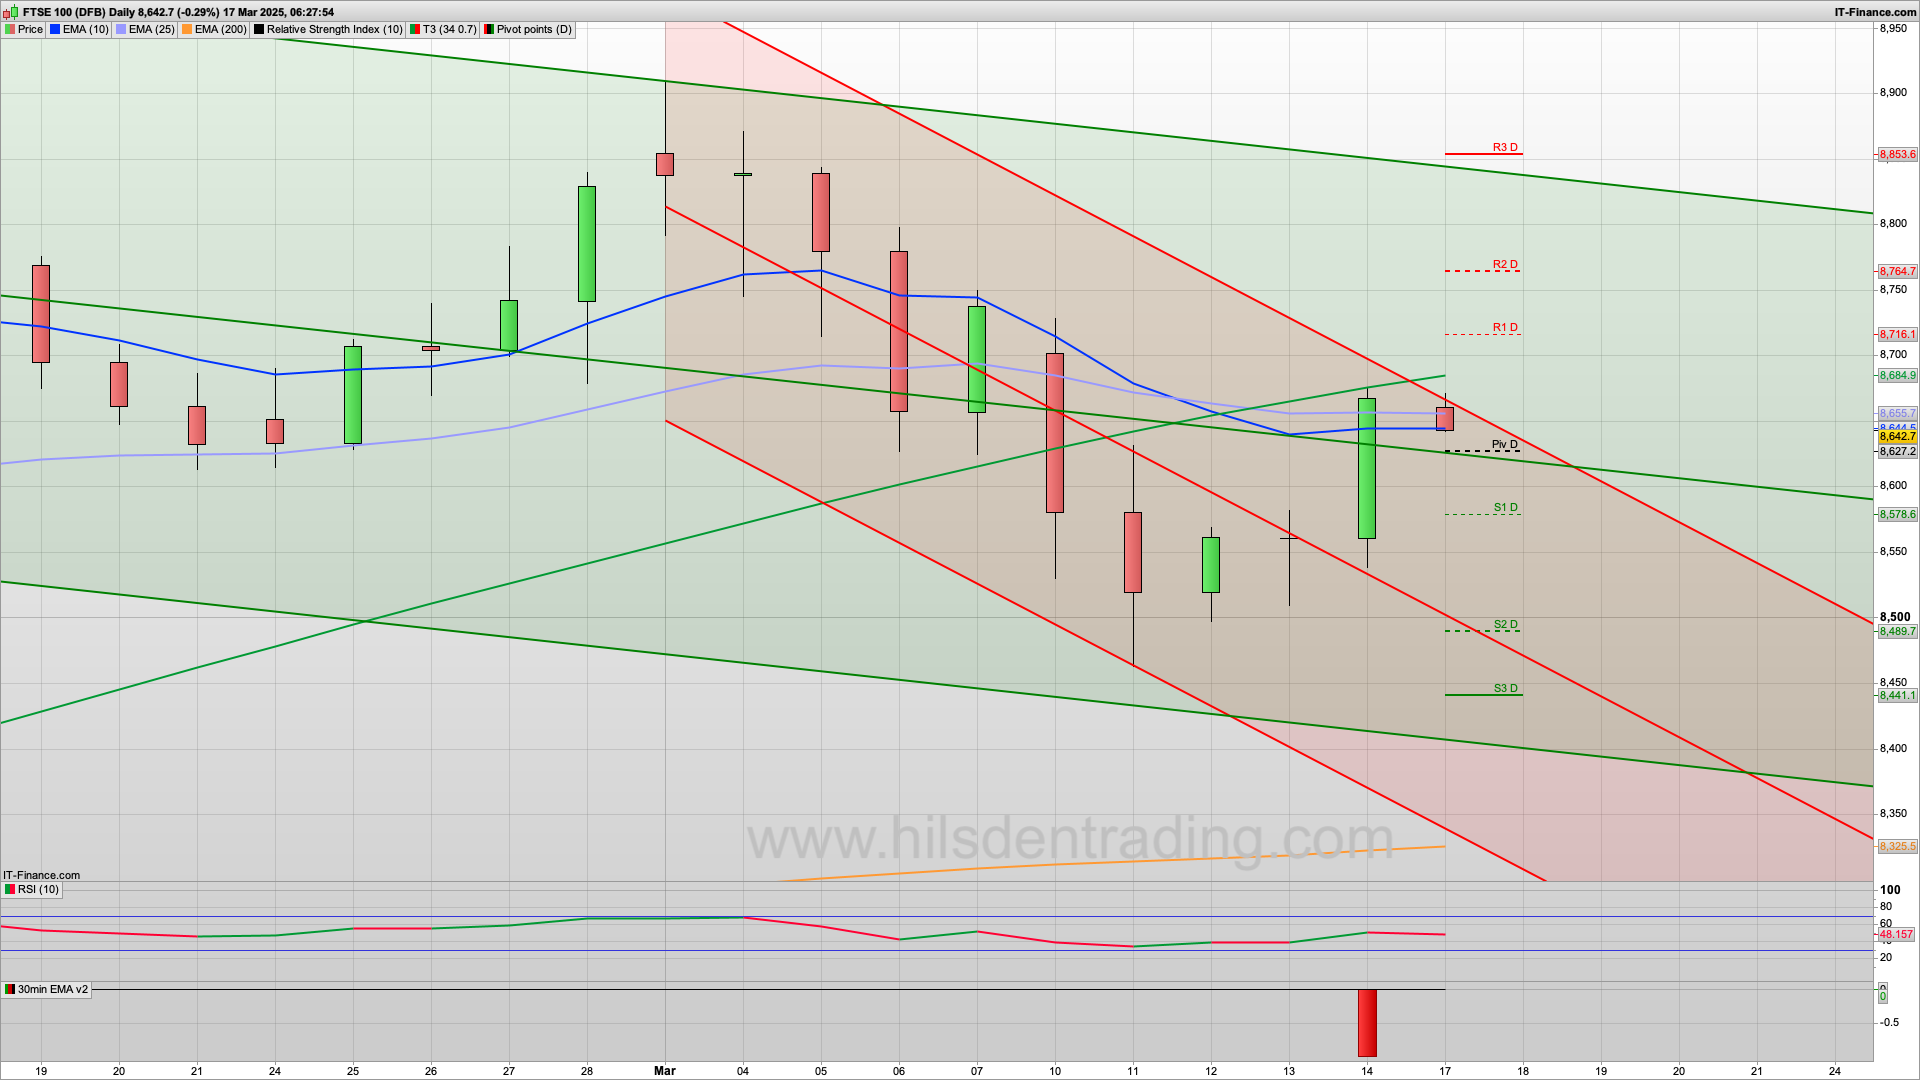
The FTSE100 daily chart gave a sell signal on Friday though with the test of the 25ema at 8655 so the bulls will be aiming for a close above that line today as we also have the top of the 10d Raff at 8670. If they manage to keep control then ultimately I am looking for a rise towards the 8780 level this week. We are still in buy the dip territory on the FTSE100.
Below the daily pivot then the bears will be aiming for the 8595 200ema, and then 8578 S1 below that. The 2h coral line is now green and has support at 8520 below that though that feels like a rather large slide for a potential bull Monday.
On the way to 8780, and if the bulls were to break above 8716 we have R2 at 8764 to jump today as well. Above 8780, and I am not expecting this today, then the top of the 20d Raff channel is now at 8850 - and a rise to this area will certainly get the headlines going!
The main news today is US retail sales for February at 12:30, expecting to show an uptick from January. Expect some volatility then. We then approach Wednesday main news event of US FOMC interest rate, expected to stay at 4.5%, though traders will be looking for hints about further cuts that could restore calm to markets.
For the Dax40 today, again the bulls will be looking to defend the daily pivot at 22871 this morning as if they can then it opens up a tie towards the 23288 R1 level. We also have a bullish 2h chart on this with the now green 30m coral at 22570 lower down. Just above the R1 level is the top of the 10d Raff channel so I expect that we may well see the bears have a go here when/if it gets tested.
The S&P500 2h chart is also bullish after Friday's rise, with the 5535 area showing as support. If the bulls can take the initiative today then we may well see the coral turn green on this today and strengthen support at the 5540 area. However the Raff channels are heading down and the top of the 10d Raff is at a fairly close 5633 initially. The 20d at R1 5663 will likely see a decent bearish reaction if it gets that high. That is also the level we spiked to on Wednesday last week before resuming declines. Worth a short at this if seen.
So generally expecting a rise and dip to play out today across the board. Good luck today.
Interested in how to start trading the FTSE 100? Frequently Asked Questions on Spread betting
Recommended Broker for trading - MT4/5, web and mobile

IC Markets - offers market leading pricing and trading conditions by providing clients with True ECN Connectivity; this allows you to trade on institutional grade liquidity from the world’s leading investment banks, hedge funds and dark pool liquidity execution venues. Highly recommended!
Membership, Trading Tips, Support and Resistance Levels with Live Trading
If you would like more detailed analysis for FTSE 100, DAX, Gold and S&P, including the trades that I am looking to take myself, then please join my active members community.
Keep up to date with new website posts, free sign up below
