
Technical analysis for FTSE 100 for 28th April 2025
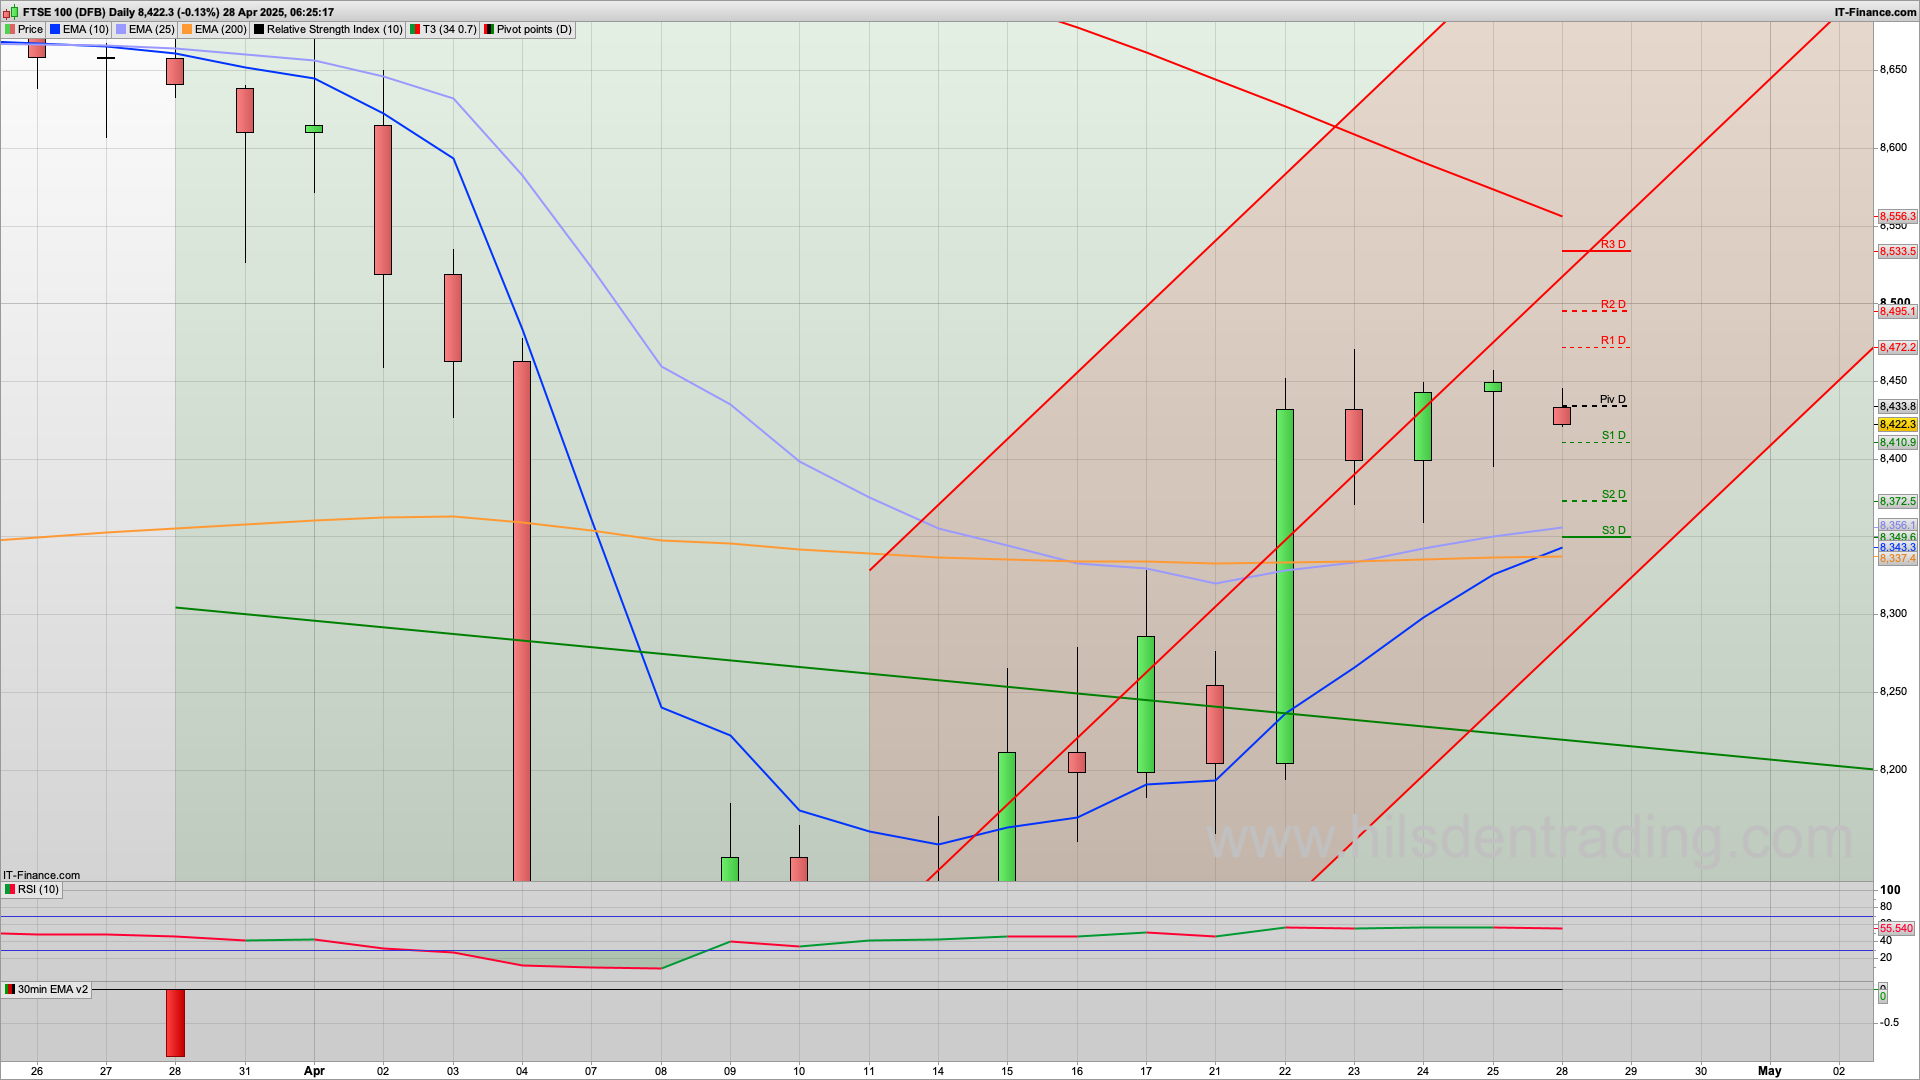
A fairly lacklustre day on Friday saw just a 50 point range for the FTSE100, however for today it fells like we are on track for a bull Monday and buying the dip is still the preferred option. The 2h chart is slightly bearish to start with, but the daily chart, and the shorter time frames are all bullish. If we get an initial drop down to the 8370 area where we have a cluster of supports, including 8360 as daily support, then a bounce here would be good. It's certainly an area that I would like to see hold if tested.
It feels like the bulls will be keen to defend this area and any foray below the 8400 level. The 2h chart has resistance at the 8473 level from the Hull MA and the bulls will be keen to break above this today. There is a lot of US companies reporting this week as well, along with NFP on Friday, so we will probably see a bit more volatility again this week. The Ukraine/Russia war seems to be moving along to a possible ceasefire as well.
Initial support is at the 8410 S1 level, and then 8382 for the 30m 200ema, 8372 for S2, key fib at 8364 and daily support 8360. As such, I am liking this area to hold if tested.
Initial resistance however is at the daily pivot at the 8433 level this morning, with the gap from Friday at 8450 above that. If they were to break above that, and ultimately the 2h Hull MA at 8473, then the bulls will be aiming for the 8500 level and we could see that later if we do get a decent rise from the supports today.
There isn't any major UK news due today, so the markets will be looking to the earnings along with the Eurozone and US inflation reports this week.
For the Dax40 today we may well see a similar pattern with the dip and rise, and I am liking the look of the round number 22000 level as support and the key fib at 22003. The 2h chart is bearish to start with as well, with 22350 resistance from the Hull MA, and just above key fib resistance at the 22330 level. Again, shorter timeframes a bit bearish, longer time daily chart is bullish with a steeply rising 10d Raff channel now.
It's a similar picture for the S&P500, with decent support at the 5475 area and a rising 10d Raff channel. The 2h chart on the S&P500 is bullish with 5485 Hull MA to start with and with S1 at 5477 then a bounce from this area would fit the charts well.
Good luck today.
Interested in how to start trading the FTSE 100? Frequently Asked Questions on Spread betting
Recommended Broker for trading - MT4/5, web and mobile

IC Markets - offers market leading pricing and trading conditions by providing clients with True ECN Connectivity; this allows you to trade on institutional grade liquidity from the world’s leading investment banks, hedge funds and dark pool liquidity execution venues. Highly recommended!
Membership, Trading Tips, Support and Resistance Levels with Live Trading
If you would like more detailed analysis for FTSE 100, DAX, Gold and S&P, including the trades that I am looking to take myself, then please join my active members community.
Keep up to date with new website posts, free sign up below
