
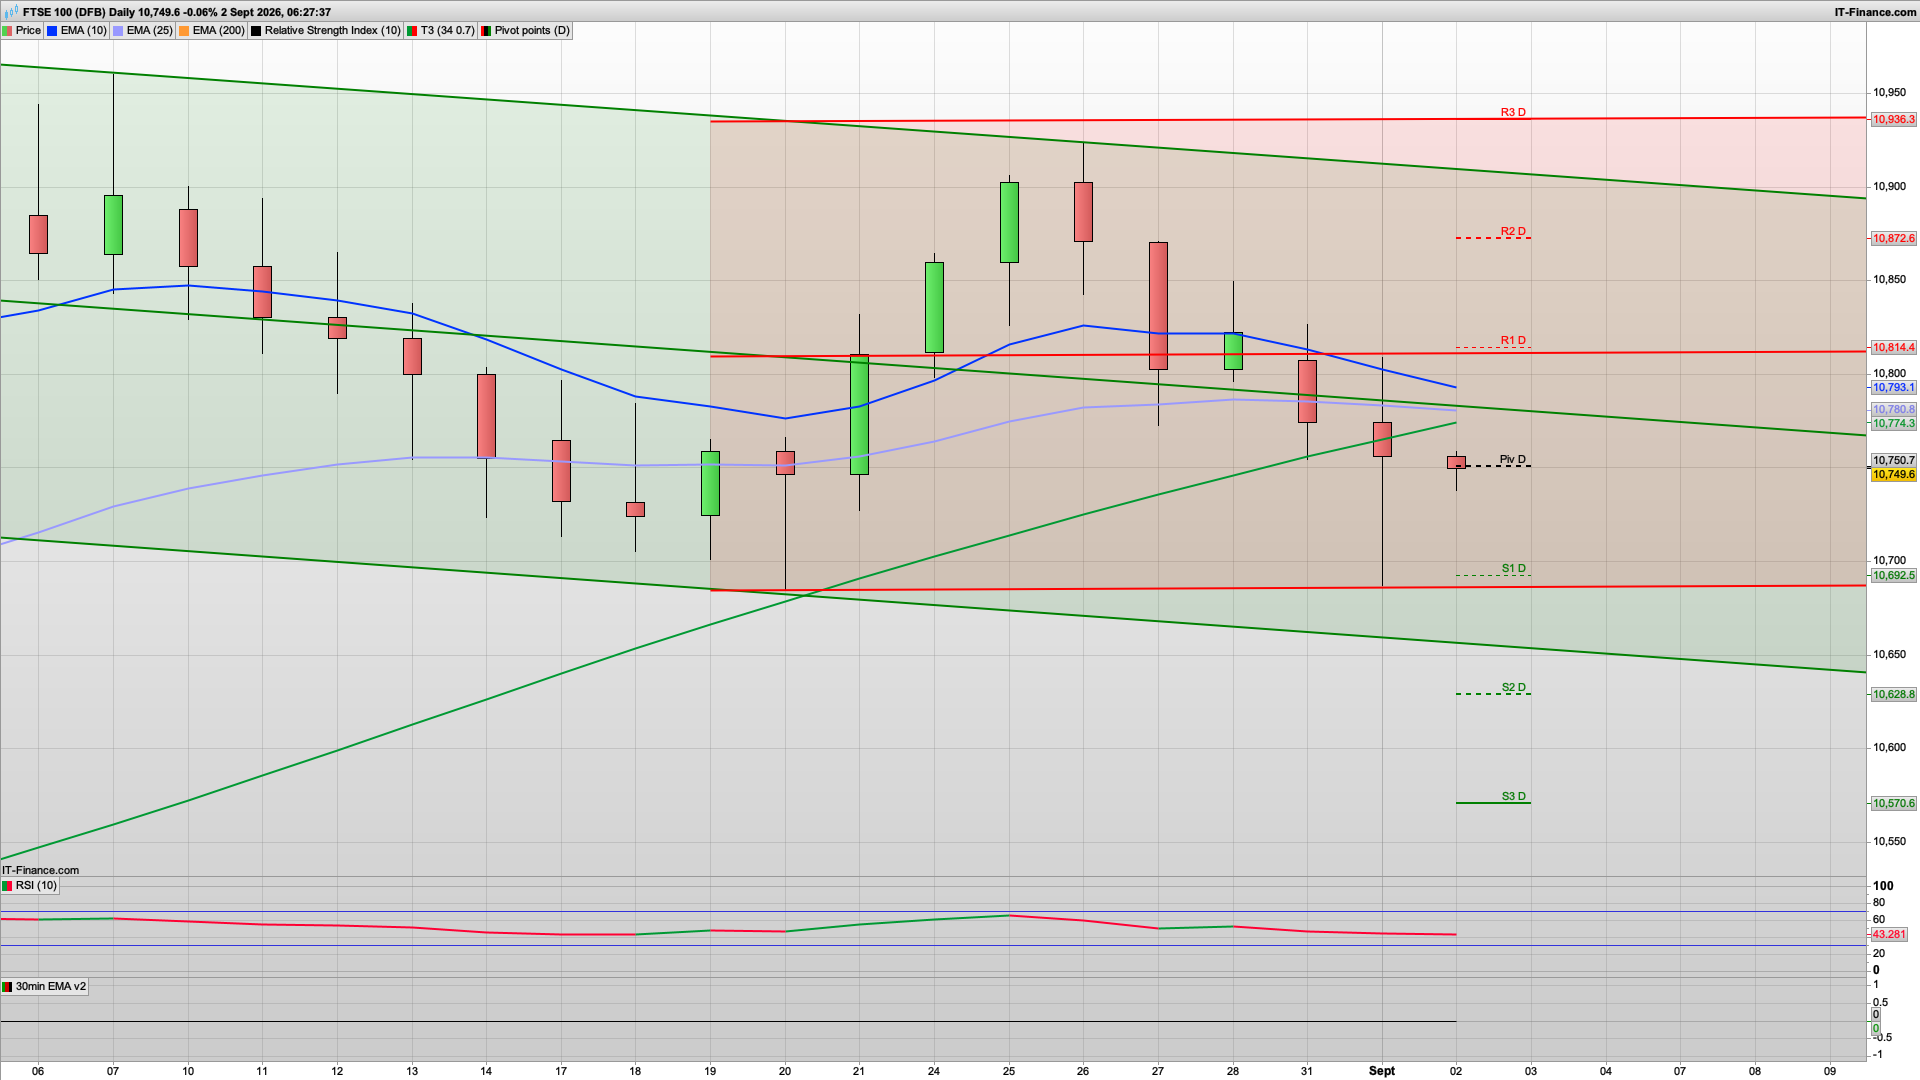
Technical analysis for 2nd September 2026
Bond yields are hitting new milestones as fighting resumes between the U.S. and Iran and oil prices surge, sending Brent crude above $95 and the yield on the U.S. 10-year Treasury bond to a three-year high. That's after the U.S. and Iran resumed attacks on each other on Tuesday, with the Pentagon saying it completed a wave of strikes against Islamic Revolutionary Guard Corps targets, and Tehran saying in turn it struck U.S. assets in Jordan and Iraq. It was the first serious exchange of fire since July.
September started with a bang with some big swings in the FTSE100 and a decent range to start the day. The macro picture has deteriorated again overnight, and today's setup is considerably more defensive. The two numbers that jump out immediately are Brent above $95 and the US 10-year Treasury yield at roughly 4.81%.
The bears drove it below the 10730 support to test the 10690 level, just shy of the 10679 daily support so that level remains the line in the sand for the moment. On the upside, the 10825 could cap upper moves once again, at least in the short term. That ties in with 10815 being the R1 and the key fib level for today.
To start with we are bang on the daily pivot at the 10750 level and we may well see the bulls come out the blocks quickly and try and pull away from this, to test that 10800 and slightly higher area again. The general back drop is considerably bearish though with the rising oil price and bond yields, though the former continues to help BP and Shell - and in turn helping the FTSE100 due to the weighting in the index.
Attention now turns towards US employment as the ADP private employment report is due today, ahead of the much more important nonfarm payrolls report on Friday.
If the bulls can break above the 10825 level today then I am looking at the 10866 level next as we have daily resistance there, just below R2 at 10872.
On the flip side, if the bears were to break below the 10680 level then look for a slide down to the 10629 S2 area, though I am not convinced that we will get that bearish today.
For more more analysis including other markets please join...
Interested in how to start trading the FTSE 100? Frequently Asked Questions on Spread betting
Recommended Broker for trading - MT4/5, web and mobile

IC - offers market leading pricing and trading conditions by providing clients with True ECN Connectivity; this allows you to trade on institutional grade liquidity from the world’s leading investment banks, hedge funds and dark pool liquidity execution venues. Highly recommended!
Join my Membership for Trading Tips, Support and Resistance Levels with Live Trading
If you would like more detailed analysis for FTSE 100, DAX40, Gold and the S&P500, including the trades that I am looking to take myself, then please join my active members community.
Keep up to date with new website posts, free sign up below