
Technical analysis for FTSE 100 for 26th June 2025
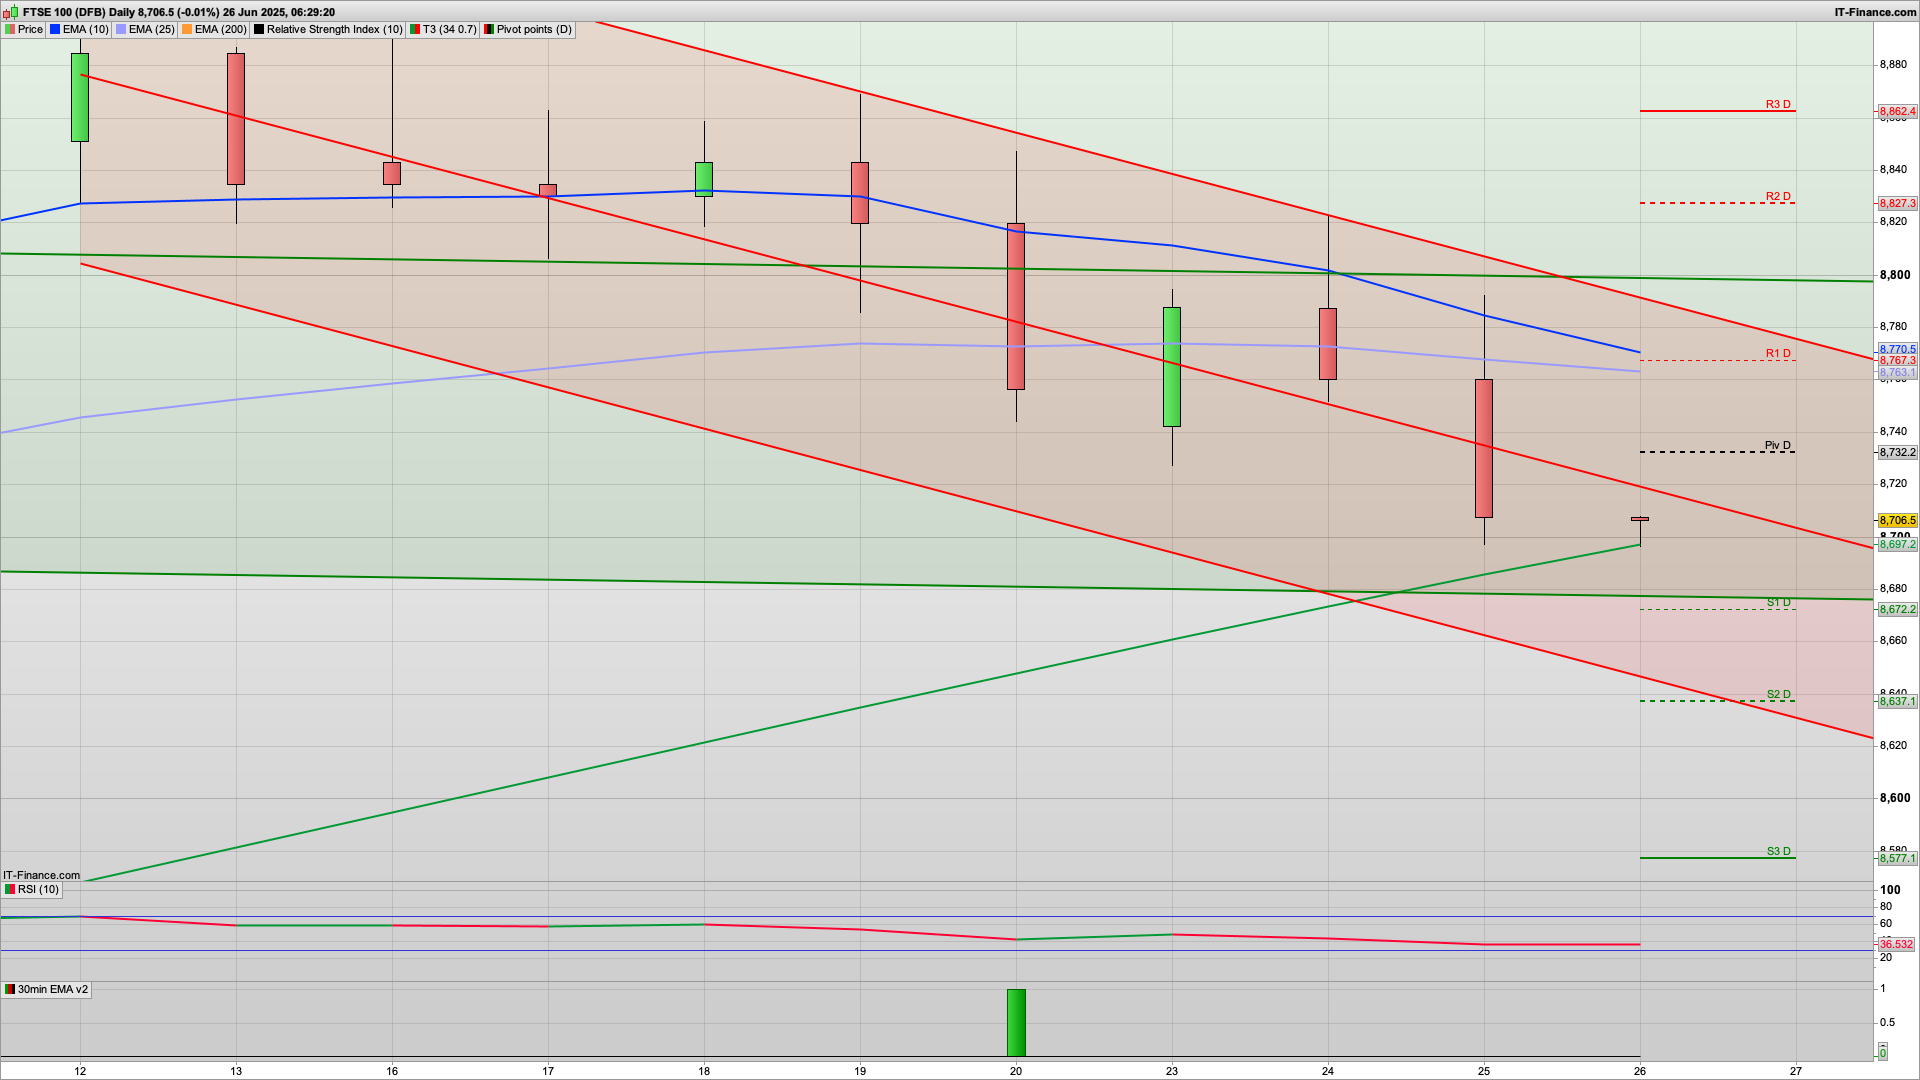
The bulls lost the battle yesterday and the bears have managed to bring it down to the 8700 area and we have a bearish 2h chart for today, with resistance at the 8730 level to start with. That is also the daily pivot so initial resistance here and a possible drop down to test the key support area at the 8672 area.
If the bulls were to break above 8730 then 8786 is the key fib and the next area of note, as we also have the top of the 10 day Raff channel here. They will of course be looking to defend the 8700 round number first thing this morning, though the charts are looking bearish to start with. The 8695 area held as support overnight. We have Bailey speaking at midday today as well which may help to give a clue when the next rate cut is coming (still think September....)
On the news front we also have the US GDP for Q1 and Initial jobless claims at 1330. The former expect to have dropped to -0.2% from 2.4% previously, and the latter at 244k versus 245k previously. Ergo expect a bit of chop at this time.
Below the overnight low then the bears will be aiming for the 8670 area where we have S1 and the key fib and it would be good to see this hold for a climb back to the daily pivot area at 8730. We also have the bottom of the 20d Raff channel for today at 8675. However, should the bears break below this then S2 and the bottom of the 10d Raff channel is likely, at 8637.
The overall bigger picture slide from 8900 continues for the time being, and having tested that profit taking and a subsequent dip are inevitable. We now need to coil and consolidate ahead of a push back to 9000+ later in the year.
It's a similar picture for the DAX40 with a rise and dip and I am looking at a test of the 23700 area where we have R1 at 23685 and the key fib at 23719. A drop from here would make sense back down to the overnight support area at 23500 as we have the 2h coral and the 30m 200ema both here. Lower down then the 23400 level should see a bounce as we have S1 and they fib here. Also note that the 2h chart is bearish with 23630 as Hull MA resistance.
The S&P500 is probably the strongest of them all (the Daddy if you will ha ha!) and will be looking to defend the 6100 level today. 6094 is the daily pivot and I can see this holding for a push towards the 6138 level today, as we also have the key fib at 6135. However, below the 6094 level then 6060 is the next level of interest with a cluster of supports here including the green 2h coral line and should hold.
Good luck today.
Interested in how to start trading the FTSE 100? Frequently Asked Questions on Spread betting
Recommended Broker for trading - MT4/5, web and mobile

IC Markets - offers market leading pricing and trading conditions by providing clients with True ECN Connectivity; this allows you to trade on institutional grade liquidity from the world’s leading investment banks, hedge funds and dark pool liquidity execution venues. Highly recommended!
Membership, Trading Tips, Support and Resistance Levels with Live Trading
If you would like more detailed analysis for FTSE 100, DAX, Gold and S&P, including the trades that I am looking to take myself, then please join my active members community.
Keep up to date with new website posts, free sign up below
