
Technical analysis for 3rd March 2026
FTSE 100 — Bullish trend but pulling back
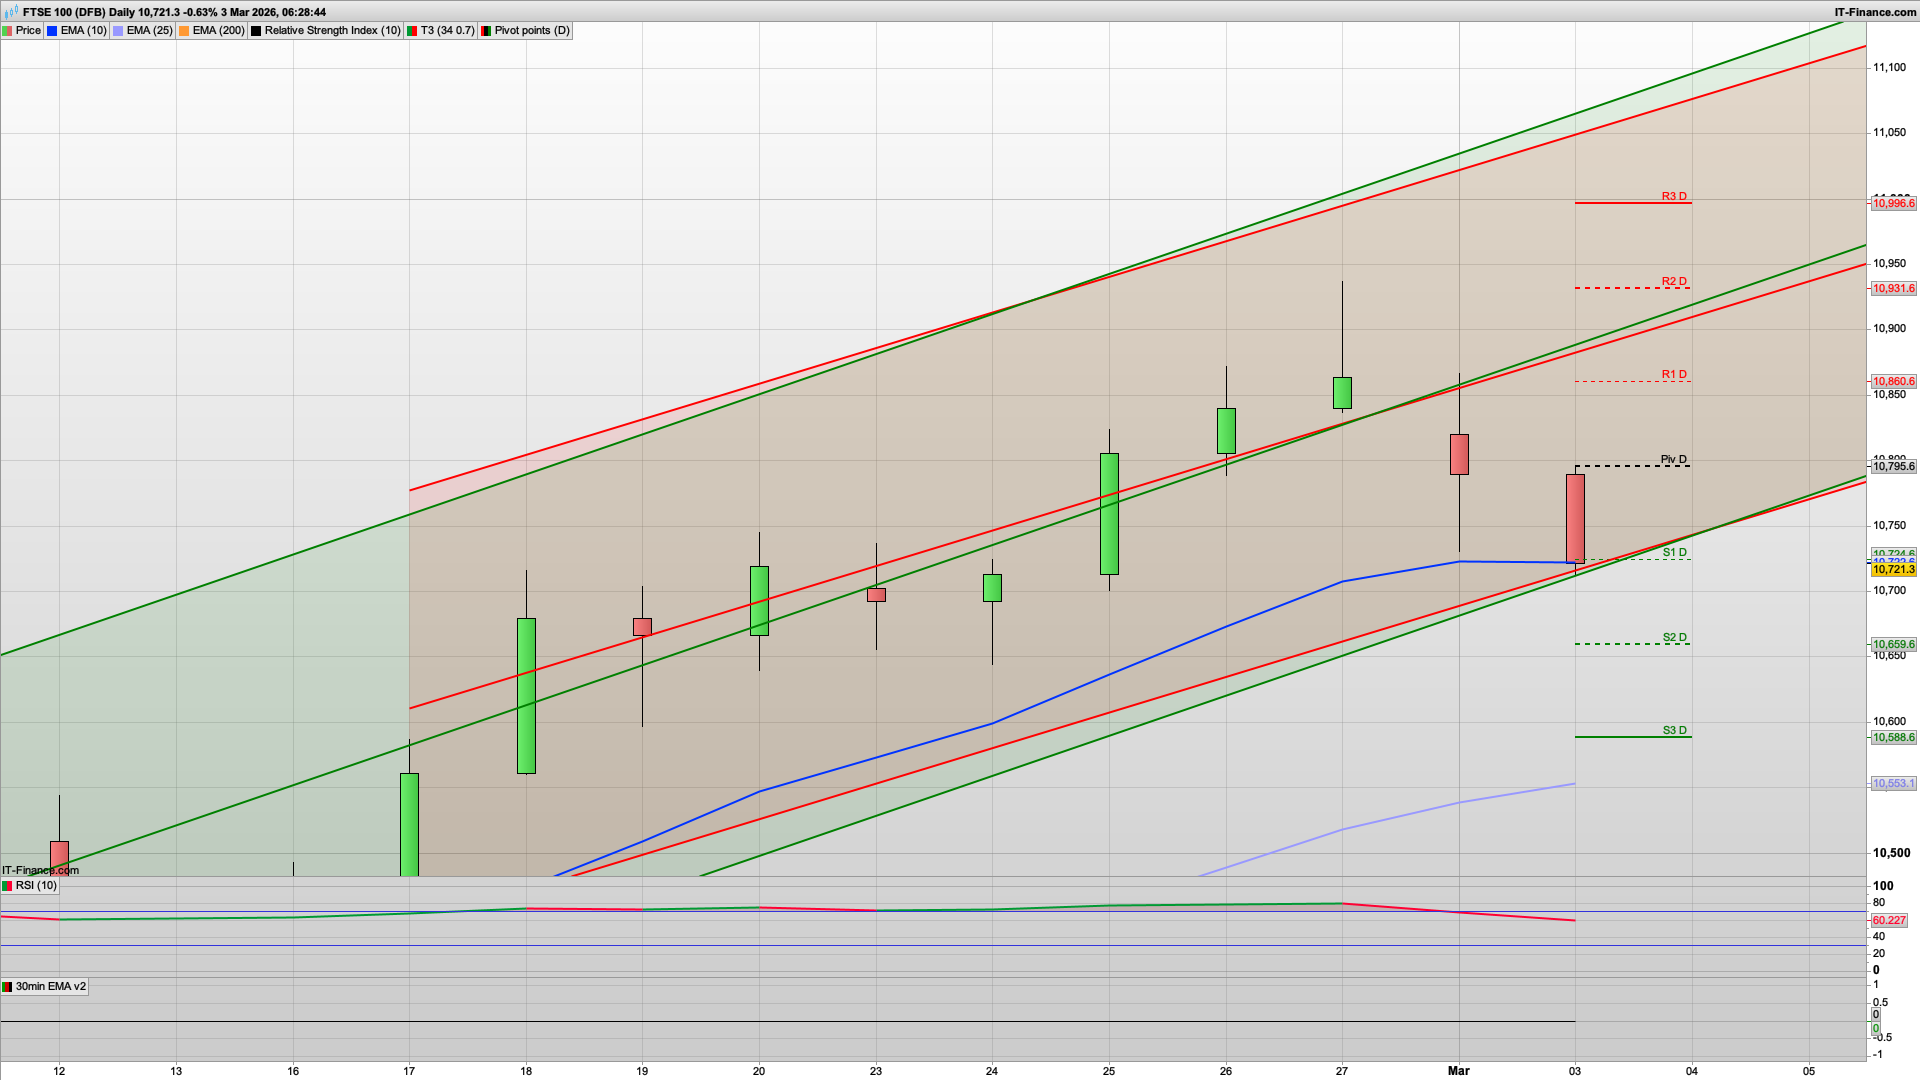
- Still in clean rising channel
- Above rising 200 EMA
- Currently pulling back toward S1 area
- Structure still higher highs / higher lows
- This is corrective, not broken.
- Bias: Buy dips near support zone
- Turns neutral only if channel midline breaks.
DAX — Bearish continuation
- Strong impulsive breakdown yesterday
- Price holding below pivot
- Below EMA cluster
- Trading in lower half of channel
- Momentum weak (RSI rolling over)
- This is not just a dip — structure has shifted short-term.
- Bias: Sell rallies
- Reclaim of pivot = first sign of stabilization.
S&P 500 — Bearish / range to downside
- Rejected near R1/R2 previously
- Back below pivot
- EMA stack still soft / flat
- Down-channel structure intact
- No impulsive reversal candle.
- Bias: Sell strength → continuation toward S1/S2
GOLD — Bullish trend, short-term correction
- Trend structure intact
- Pullback from upper channel
- Still above major EMA support
- Sitting around pivot zone
- No structural breakdown yet.
- Bias: Buy pullbacks (not highs)
- Only bearish if it loses S1 + channel base.
The lower support at 10740 held yesterday but has broken overnight which opens up the likelihood for a drop down to the next daily support level at the 10660 area. Adding weight to this is that we have S2 here as well so should the bears take it that low then a bounce here may well materialise. We are still in short the rallies mode for obvious reasons, and also as we continue to drop from the 10900 area.
Generally looking like a bear Tuesday and any test of the pivot area at the 10795 level (might be a bit optimistic though!) is a shorting opportunity. Should the bulls break above that though then the 10860 area is decent resistance on the 2h chart, with both the Hull and coral here.
News of increased attacks on Tehran as I am writing this adding to the bearishness, and that has led to the FTSE100 just dipping below the bottom of the Raff daily channels at 10720.
If the bears were to break below the 10660 level then 10588 is S3 and ultimately the 10505 daily support level lower down. Oil and gas continues to rise (helping BP and Shell!) but with OPEC increasing output, along with the Venezuelan oil that the US can us may well cap it a bit and stop the $100 per barrel.
Similar picture really for the DAX40 and S&P500 in terms of selling any rallies - 10525 and 6868 respectively.
Good luck today.
Interested in how to start trading the FTSE 100? Frequently Asked Questions on Spread betting
Recommended Broker for trading - MT4/5, web and mobile

IC Markets - offers market leading pricing and trading conditions by providing clients with True ECN Connectivity; this allows you to trade on institutional grade liquidity from the world’s leading investment banks, hedge funds and dark pool liquidity execution venues. Highly recommended!
Join my Membership for Trading Tips, Support and Resistance Levels with Live Trading
If you would like more detailed analysis for FTSE 100, DAX40, Gold and the S&P500, including the trades that I am looking to take myself, then please join my active members community.
Keep up to date with new website posts, free sign up below
