
Technical analysis for FTSE 100 for 15th July 2025
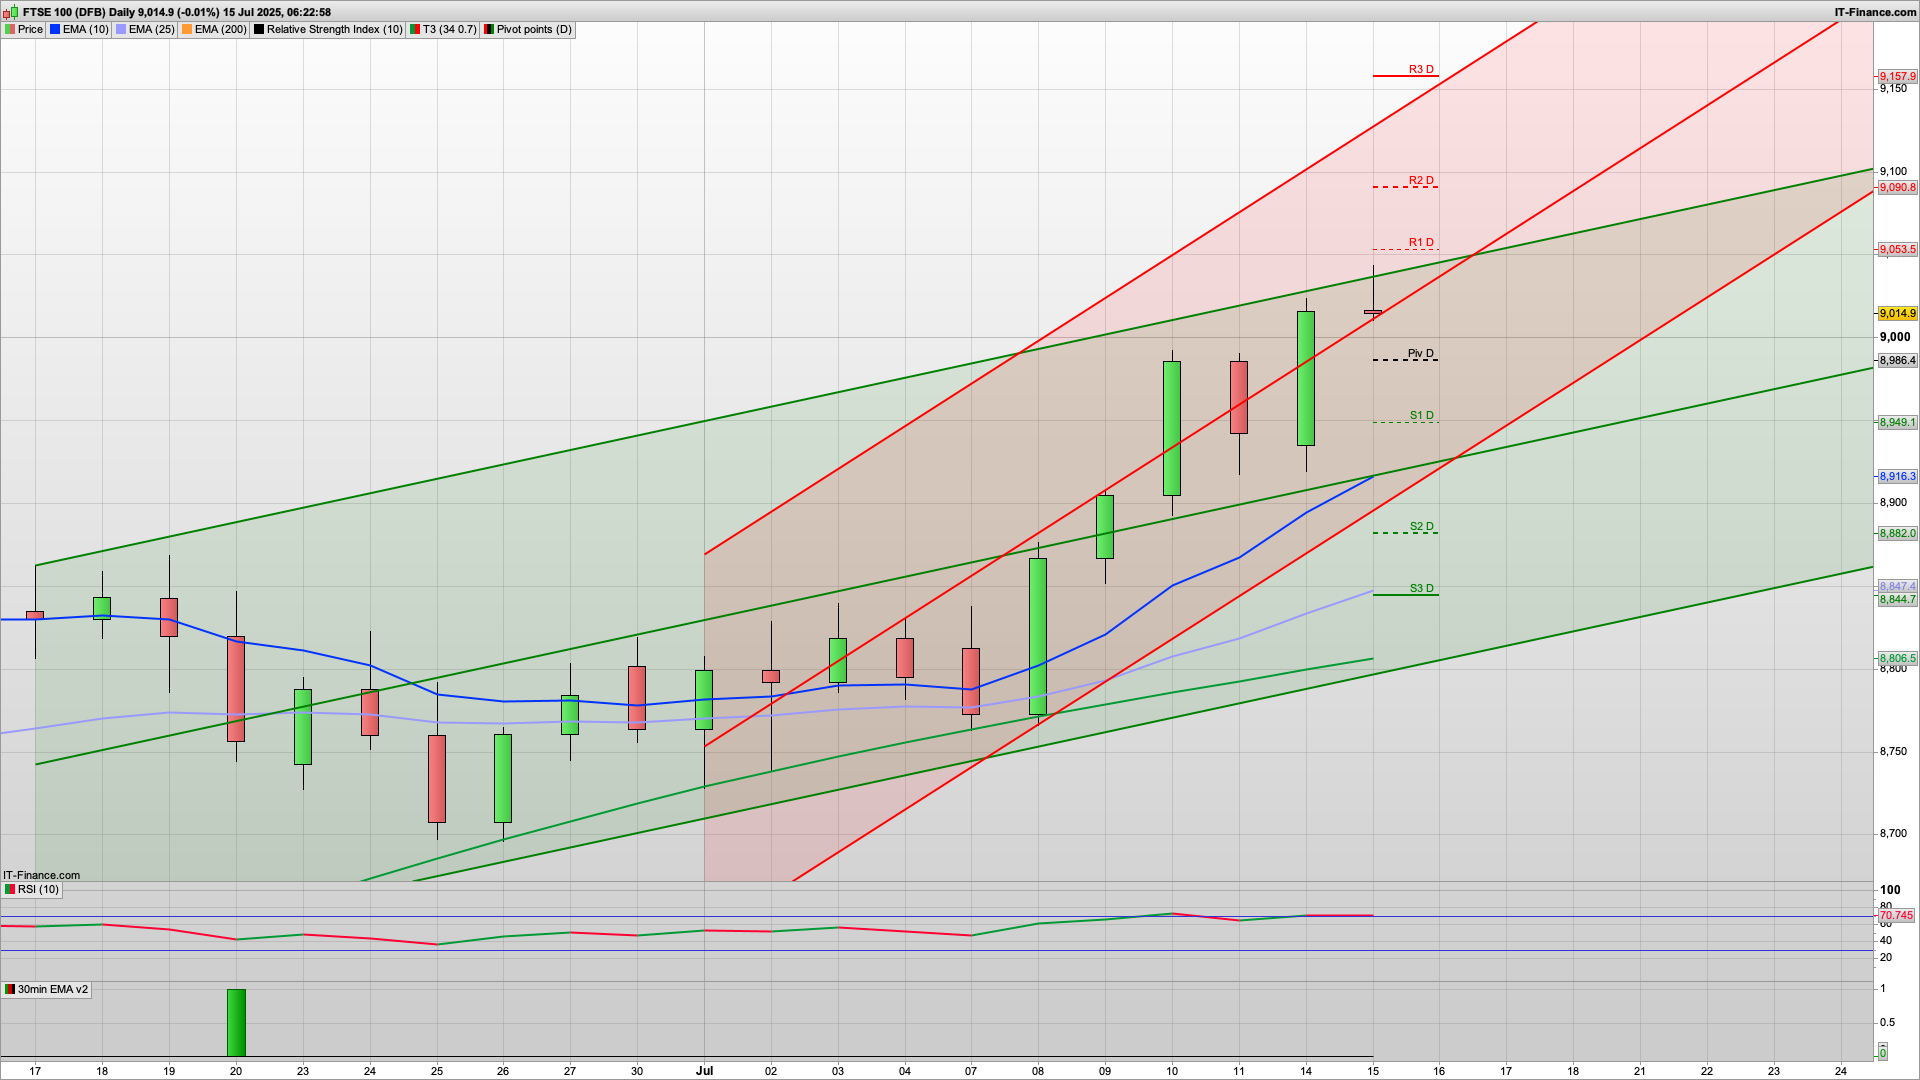
Well that was certainly a bull Monday with the smallest reaction off the 8980 resistance as the bulls fought it up towards the 9000 level again. This time they managed to hold onto it pretty well which bodes well for the test of the 9075 resistance area next. Overnight we have seen 9045....
Initially today we have resistance from R1 and the key fib at 9052 so we could see any early rise stutter here and a drop back down to the daily pivot at 8986 as the bears attempt a bear Tuesday. We are coming into earnings season now and also rate cuts are also back in the news with a possible BoE cut in August (more likely September though).
Above the 9053 level then 9074 as mentioned is the next level of note, with 9090 for R2. All that said 9040 is also the top of the 20d Raff channel so just to lend a bit of weight to that first resistance level. Both Raff channels continue to head up and the 2h chart is firmly bullish with Hull MA support at 9007 to start with.
If the bears were to break 9000 then the daily pivot at 8986 is next up and I would like to see the bulls mount a defence here. There is certainly a lot of buy the rumour at the moment which is making it hard for the bears to get a look in. However, if the pivot were to break then we have a cluster of supports around the 8930 area with the S1 8949 just above. 8930 is the key fib and daily support also being yesterdays low area. I have a hunch that the bulls will try and build on yesterday's rise though and initially try and pull away from the 9000 area.
For the DAX40 today, we may well see another test of the overnight high at the 24300 level but with R1 and the key fib resistance both here may well see the bears have a go. That is also the Hull MA resistance on the still bearish 2h chart for this index (the only bearish 2h chart of the ones I am watching/trading) so a drop off from here down to the daily pivot and green 30m coral at 24130 would make sense. Above 24307 then 24400 is R2 and should get a round number reaction as well. S1 support lower down at 24025 links in with the bottom of both the Raff channels too.
The S&P500 has initial resistance at the 6295 key fib and 6305 R2 just above, as such a drop down from this round number 6300 level to the daily pivot at 6250 would also fit the chart well, and then a subsequent bounce there. 6250-6260 has support also from the 30m 200ema and the coral, so the bulls would be keen to defend any drop down to here. 6264 is also the Hull MA on the 2h chart. Above 6305 will likely see the bulls aim for the top of the 10d Raff channel at 6325 and then 6338 R3, though that may be a bit of a stretch for today.
Good luck.
Interested in how to start trading the FTSE 100? Frequently Asked Questions on Spread betting
Recommended Broker for trading - MT4/5, web and mobile

IC Markets - offers market leading pricing and trading conditions by providing clients with True ECN Connectivity; this allows you to trade on institutional grade liquidity from the world’s leading investment banks, hedge funds and dark pool liquidity execution venues. Highly recommended!
Membership, Trading Tips, Support and Resistance Levels with Live Trading
If you would like more detailed analysis for FTSE 100, DAX40, Gold and the S&P500, including the trades that I am looking to take myself, then please join my active members community.
Keep up to date with new website posts, free sign up below
