
Technical analysis for FTSE 100 for 22nd July 2025
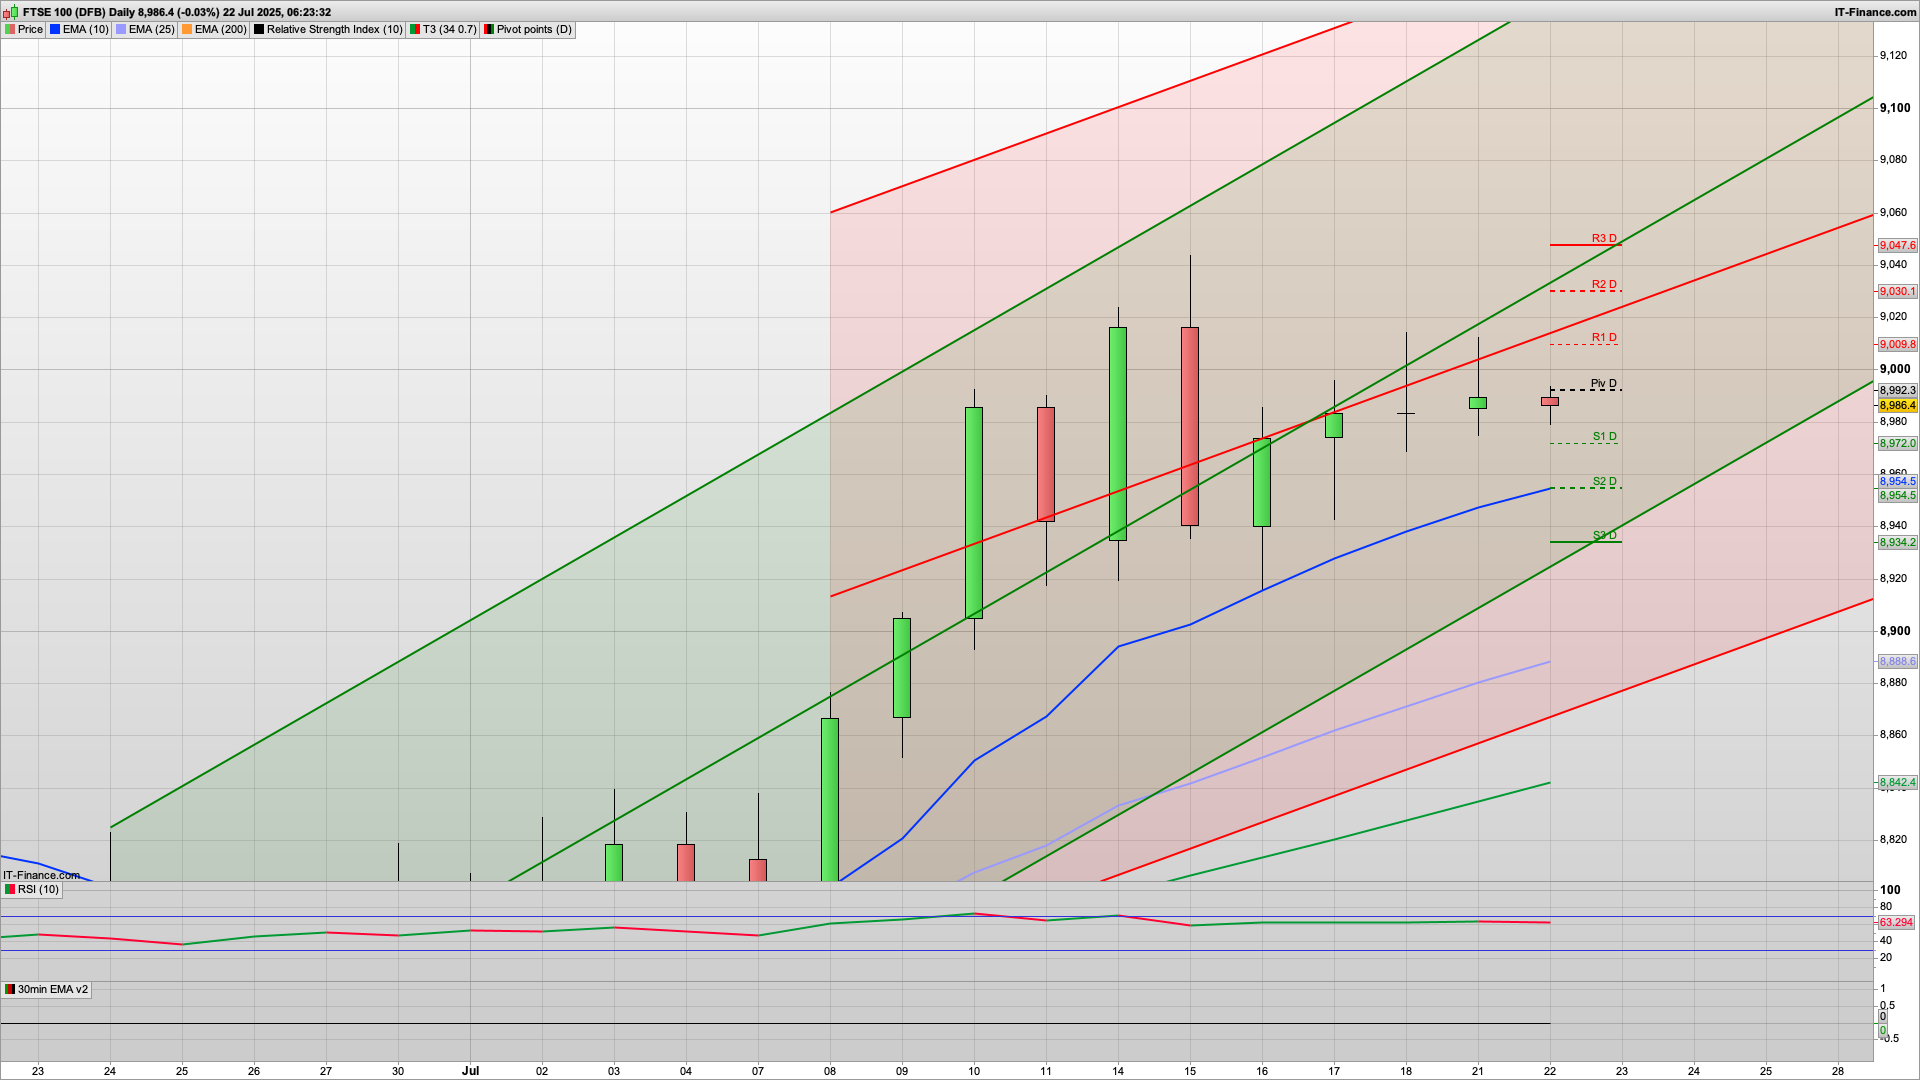
A decent double top reaction at the 9010 level yesterday and a modest drop down each time, but we may well see a bit of a bear Tuesday play out today and a test of the 8950 support level. If we do then a bounce here would make sense for the bulls to have another assault on 9000. The past few daily candles have got long tails and wicks which suggests a bit of indecisiveness/consolidation - so we may well see the summer sell off start early next week/back end of this week.
Initial resistance today is at the 8992 daily pivot and then 9009 for R1 so should we see an initial kick up towards the 9000 level then it is probably worth adding to yesterdays short that is still running.
If the bulls were to break above the 9010 level today then I am still looking at the 9050 area as decent resistance and worth shorting if seen - 9053 is also the key fib for today to add some weight to this daily resistance level. 9047 is also R3 for today.
It probably won't get past that but if it did then 9075 is the next level of note.
Support wise, initially we have the 200ema at the 8979 level and a double bottom area with yesterday's low so we could see this hold, but a break of this will likely lead to that 8950 level mentioned. This is S2 and daily support, and then we have 8936 key fib support below that. I am thinking that the bulls will be keen to defend the 8950 level if it gets that low.
So a bit of a bear Tuesday on the FTSE100 may well be possible today with the 8950-9010 range in play.
For the DAX40 it also looks similar with the initial resistance at the 24255 daily pivot level and 30m 200ema. If the bears have a go off this then they will be trying to drive it down to the 24105 level where we have S2 and the key fib both as support, along with it being the round number (or just above). S1 prior to that is 24178. and has held a few tests overnight so may well break if tested in hours. Above the daily pivot then 24327 is R1 and the high of yesterday for a double top test, though it probably won't get that high today, at least initially.
The S&P500 also presents a similar picture with 6319 as the red 30m coral, and the 6316 daily pivot level, as the initial resistance level to look for. The 2h chart is also about to go bearish which would lock in 6315 as the Hull MA resistance. A slide down to the 6281 S2 level would make sense and then a bounce as that is just below Friday's low and would be a good double bottom that saw the previous bounce.
Good luck today
Interested in how to start trading the FTSE 100? Frequently Asked Questions on Spread betting
Recommended Broker for trading - MT4/5, web and mobile

IC Markets - offers market leading pricing and trading conditions by providing clients with True ECN Connectivity; this allows you to trade on institutional grade liquidity from the world’s leading investment banks, hedge funds and dark pool liquidity execution venues. Highly recommended!
Membership, Trading Tips, Support and Resistance Levels with Live Trading
If you would like more detailed analysis for FTSE 100, DAX40, Gold and the S&P500, including the trades that I am looking to take myself, then please join my active members community.
Keep up to date with new website posts, free sign up below
