
Technical analysis for 15th May 2026
FTSE 100
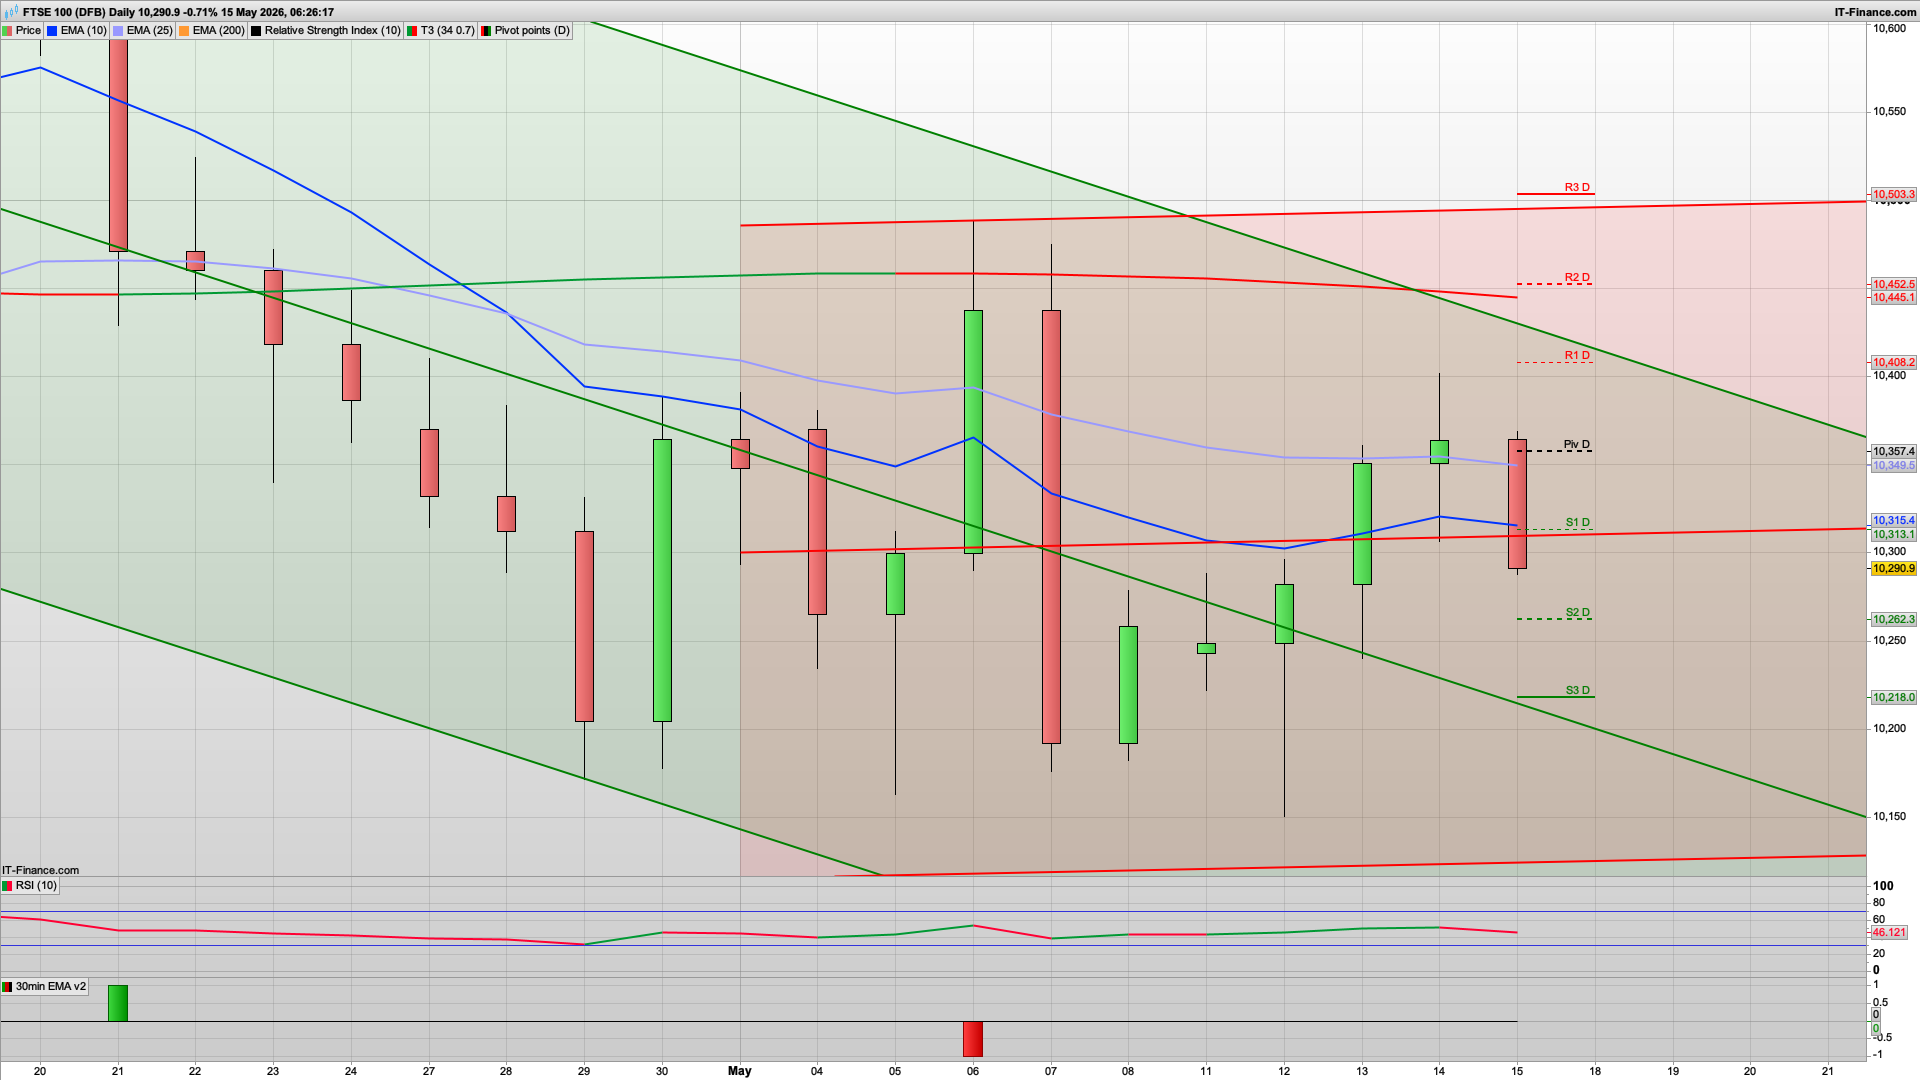
- Bias: Bearish
- Rejected again from the EMA/pivot zone
- Still trapped in broader falling channel
- Relative weakness versus US markets remains clear
- Key levels
- Resistance: 10,408 → 10,452 → 10,503
- Support: 10,313 → 10,262 → 10,218
- Trading view
- Sell rallies remains preferred
- Below 10,300 opens room toward 10,220
- Needs a decisive reclaim above 10,400 to improve outlook
- FTSE continues to lag badly.
DAX40
- Bias: Bearish / sell rallies
- Failed to hold above the pivot and short-term EMA structure
- Lower-high sequence still intact after repeated rejection around 24,300–24,400
- Momentum rolling over again with sellers back in control early
- Key levels
- Resistance: 24,347 → 24,492 → 24,643
- Support: 24,075 → 24,046 → 23,895
- Trading view
- Preference remains short below the pivot
- Any bounce into 24,250–24,350 likely attracts sellers
- Break below 24,050 could accelerate downside toward 23,900
- DAX remains one of the weaker equity indices.
NASDAQ
- Bias: Neutral to mildly bearish today
- Strong uptrend still intact structurally
- But today opens with a sharp rejection candle from upper channel resistance
- First meaningful pullback signal after extended momentum run
- Key levels
- Resistance: 29,649 → 29,831 → 29,985
- Support: 29,314 → 29,160 → 28,978
- Trading view
- Short-term corrective bias today
- Likely rotational/pullback trade unless buyers reclaim pivot quickly
- Dips toward S1/S2 likely to find support later
- Trend is still bullish overall, but today looks more like profit-taking than momentum continuation.
S&P 500
- Bias: Mild bullish
- Rising channel structure still very healthy
- Pullbacks continue to hold trend support
- Momentum softer than earlier this week but still constructive
- Key levels
- Resistance: 7,518 → 7,552 → 7,588
- Support: 7,449 → 7,413 → 7,383
- Trading view
- Bias remains buy dips while above 7,430–7,450
- More controlled trend than NASDAQ
- Bullish continuation likely resumes if US session stabilises
- S&P still the cleaner bullish structure overall.
GOLD
- Bias: Bearish
- Strong bearish candle breaking below EMA/pivot cluster
- Momentum now turning lower after repeated failure at upper channel resistance
- First proper downside expansion move in several sessions
- Key levels
- Resistance: 4,706 → 4,750 → 4,782
- Support: 4,631 → 4,600 → 4,556
- Trading view
- Favour selling rallies today
- Momentum likely remains heavy below 4,675
- Break under 4,600 could extend sharply lower
- Gold now has the clearest bearish momentum setup on the board.
Best Opportunities Today
- Best Long Setup
- S&P dip buys near support
- Best Short Setups
- Gold rallies
- DAX40 weakness below pivot
- FTSE100 failed rallies
- More Cautious Market
- NASDAQ (pullback phase after strong run)
Market Theme Today
- Today looks more risk-off than earlier this week:
- European indices remain weak
- Gold has broken lower
- NASDAQ showing first meaningful exhaustion candle
- S&P still relatively resilient
- Current higher-probability approach:
- fade weak European bounces
- treat US tech more cautiously
- favour short-term downside momentum in gold until structure improves.
We got a late test of the 10390 resistance yesterday after the bell which has seen the decent bearish reaction from this key resistance level. The bulls really need to recapture the 10400 level to gain any further upside in the next few sessions but the FTSE100 remains jittery for the time being. Having now dropped to test S2 already this morning pre-market we could see some further fear driven selling initially to test the S3 level art the 10215 level before a small bounce to retest the daily pivot at the 10357 but more likely stalling at a back test of S1 at 10310. This is also the 30m 200ema so should in theory get a decent reaction if tested.
We do also have a green coral not eh 2h at 10285 which we are slightly below as I am writing this but could provide some support to the early bulls, especially as it is just above the S2 level 10262.
If the bears were to break below S3 then 10181 is the next daily support level of note with a possibility that we will slide down to the 10015 area in the next few sessions.
Yesterday 0.6% GDP figure is being questioned by a few quarters as a "statistical anomaly" as well, rather than any sign of any significant growth in another blow to Labour.
For the bulls they will be looking to retrace this overnight drop but apart from the S&P500 nearing decent support at the 7430 area the other markets look weak - if the US were to bounce from this level then it may well help the FTSE100 to climb.
The main focus on the news front will be Trump's China visit and any talk of Middle East resolution.
Good luck today and have a great weekend.
Interested in how to start trading the FTSE 100? Frequently Asked Questions on Spread betting
Recommended Broker for trading - MT4/5, web and mobile

IC Markets - offers market leading pricing and trading conditions by providing clients with True ECN Connectivity; this allows you to trade on institutional grade liquidity from the world’s leading investment banks, hedge funds and dark pool liquidity execution venues. Highly recommended!
Join my Membership for Trading Tips, Support and Resistance Levels with Live Trading
If you would like more detailed analysis for FTSE 100, DAX40, Gold and the S&P500, including the trades that I am looking to take myself, then please join my active members community.
Keep up to date with new website posts, free sign up below
