
Technical analysis for 6th August 2026
The overall picture remains constructive, although several markets are now pulling back after yesterday's strong advances. At this stage, I still view these as retracements within existing uptrends rather than trend reversals.
After the strong start to August, today's market feels a little more balanced. Yesterday's weaker-than-expected ADP employment report reinforced the idea that the US labour market is gradually cooling. Normally that would be supportive for equities because it reduces the pressure on the Federal Reserve to raise interest rates again. However, overnight the market has shifted its attention back towards technology.
Disappointing reactions to earnings from AMD and SpaceX weighed on semiconductor shares across Asia, interrupting the strong AI-led rally we've seen over the past week. That doesn't mean the broader AI story is over. What it does tell us is that investors are becoming much more selective. Companies need to deliver both growth andprofitability. Simply talking about AI investment is no longer enough.
Meanwhile, oil prices have stabilised around the $79 area as negotiations between the United States and Iran continue. That is helping keep inflation expectations under control and has allowed Treasury yields to ease further.
Tomorrow's US Non-Farm Payrolls report now becomes the week's major event.
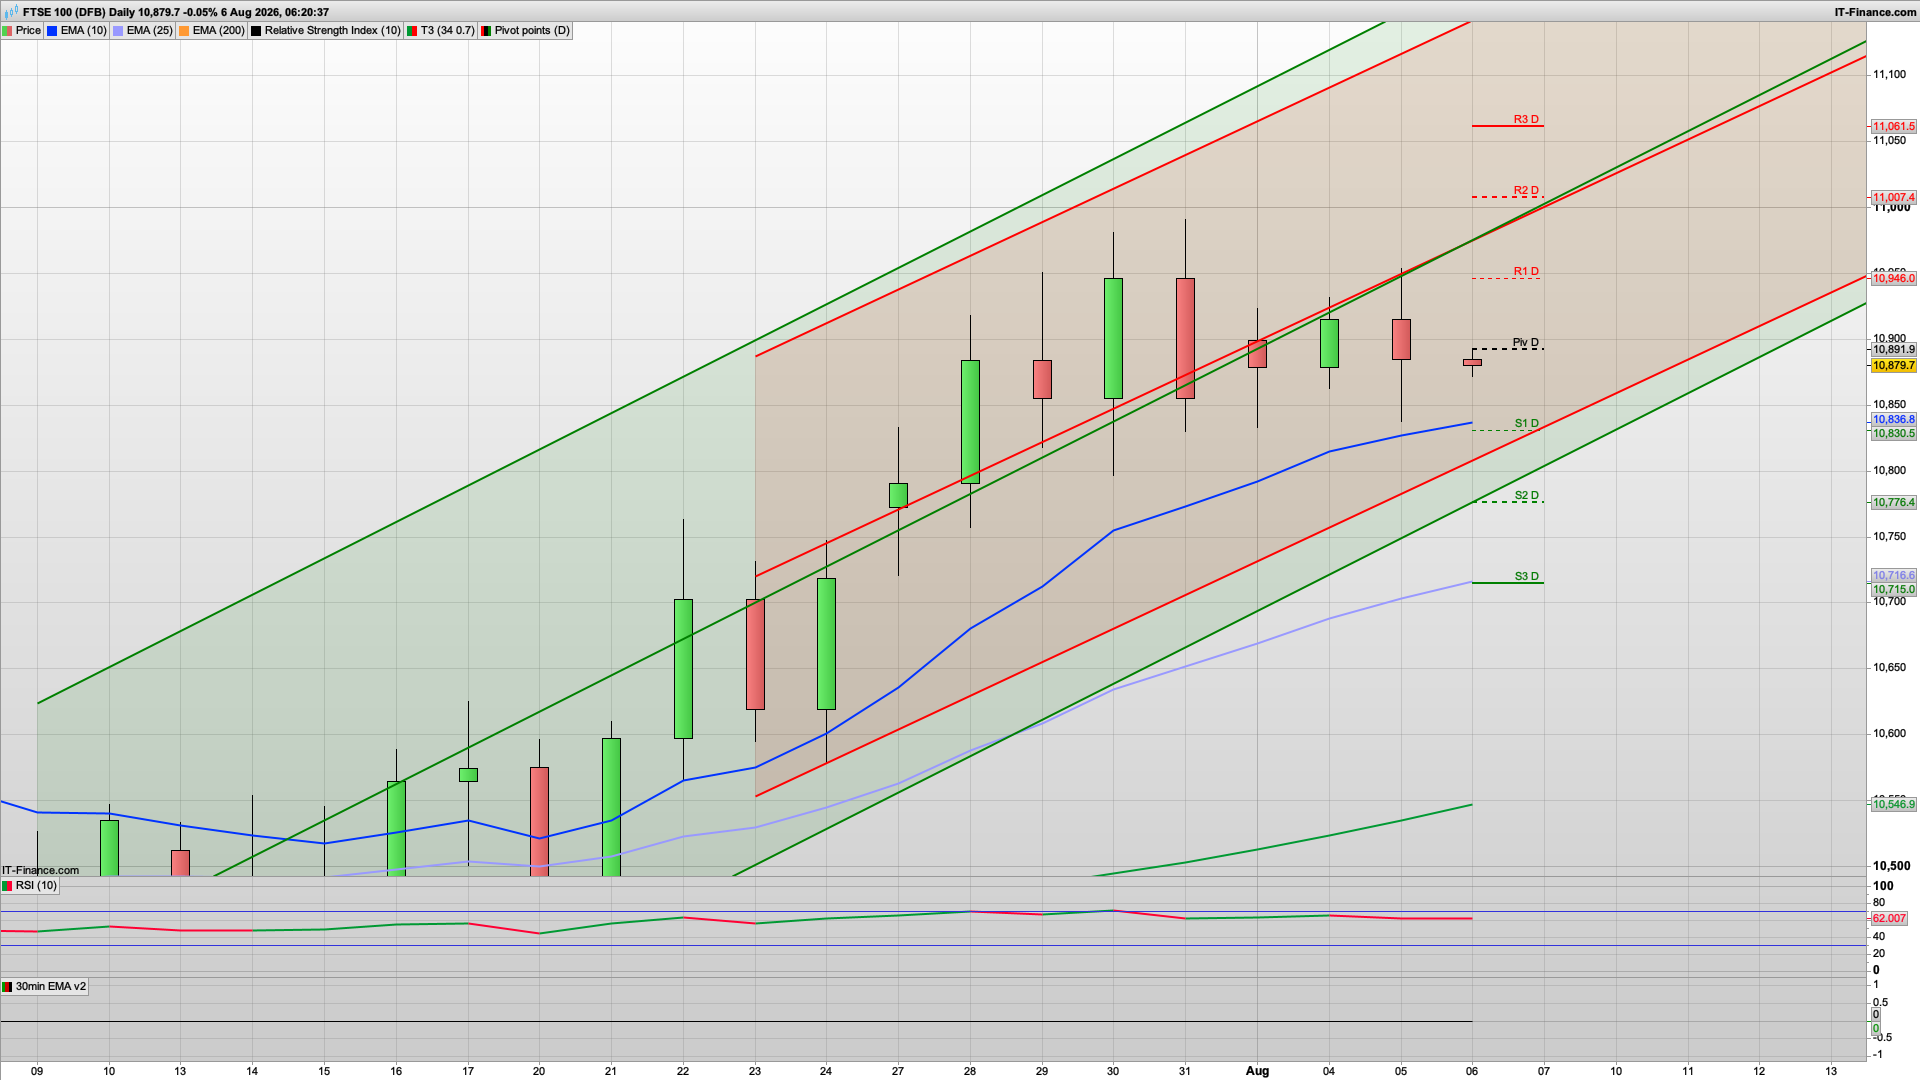
FTSE 100
Bias: Bullish
- The FTSE continues respecting its rising trend channel.
- Technical picture
- Trend remains higher.
- Price continues making higher lows.
- Holding above the 10 EMA.
- Recent candles show consolidation rather than weakness.
DAX 40
Bias: Bullish (buy pullbacks)
- Yesterday's red candle looks like profit-taking after a very strong run.
- Technical picture
- Trend channel remains firmly upward.
- Price is still comfortably above both the 10 EMA and 25 EMA.
- Pullback is occurring into Pivot support rather than breaking trend.
- RSI has cooled from overbought, which is actually healthy.
S&P 500
Bias: Bullish
- The uptrend remains intact despite yesterday's pause.
- Technical picture
- Price continues trading above both moving averages.
- Trend channel remains positive.
- Small bearish candle following a strong rally is normal.
- Buyers still have control while above Pivot.
Nasdaq 100
Bias: Neutral to Bullish
- The Nasdaq is at an important decision point.
- Technical picture
- Yesterday produced a bearish candle after testing resistance.
- Still holding above both moving averages.
- Trend has improved materially, but overhead resistance around 30,000 remains significant.
- A break below the Pivot would increase the chance of a deeper pullback.
Gold
Bias: Strong Bullish
- Gold is now the strongest chart of the group.
- Technical picture
- Huge bullish breakout candle.
- Strong close above both moving averages.
- Trading above the daily Pivot.
- Momentum has shifted decisively in favour of buyers.
- The only caution is that price is approaching the long-term 200 EMA (around 4,290), which could act as resistance.
Strength Ranking
- Gold – Strongest breakout and momentum has turned sharply positive.
- DAX 40 – Uptrend remains intact despite a healthy pullback.
- FTSE 100 – Continues to trend steadily higher within its channel.
- S&P 500 – Bullish structure intact, but consolidating after recent gains.
- Nasdaq 100 – Still constructive, though facing the toughest overhead resistance and requiring confirmation.
Overall Market View
The broader trend across the major indices is still bullish, but today's charts suggest a session where buying quality pullbacks is preferable to chasing strength. The DAX and FTSE 100 continue to respect their rising channels, the S&P 500 remains constructive after a brief pause, and Gold stands out as the strongest technical setup following its decisive breakout. The Nasdaq 100 warrants the most caution due to nearby resistance, but unless key support levels fail, the dominant strategy remains to look for long opportunities rather than fading the prevailing uptrends.
Interested in how to start trading the FTSE 100? Frequently Asked Questions on Spread betting
Recommended Broker for trading - MT4/5, web and mobile

IC Markets - offers market leading pricing and trading conditions by providing clients with True ECN Connectivity; this allows you to trade on institutional grade liquidity from the world’s leading investment banks, hedge funds and dark pool liquidity execution venues. Highly recommended!
Join my Membership for Trading Tips, Support and Resistance Levels with Live Trading
If you would like more detailed analysis for FTSE 100, DAX40, Gold and the S&P500, including the trades that I am looking to take myself, then please join my active members community.
Keep up to date with new website posts, free sign up below