
FTSE100 Analysis | Signals | Forecast | Prediction | FTSE 100 Outlook | Trading help
Stocks in Asia resisted mounting signs of a sharp economic slowdown that are weighing on bond yields and commodity prices, a schism underlining some of the tension in global markets.
An Asia-Pacific equity index was propped up by modest gains in China and Hong Kong. Stocks and dollar bonds of Chinese developers rallied on a possible moveto let state-owned firms guarantee the sale of new onshore notes. S&P 500 and Nasdaq 100 futures were steady while European contracts rose.
Asian markets struggled for direction on Tuesday, weighed by worries over global growth following weak China data that knocked oil prices and commodity-linked currencies.
The dollar held near a one-week high as investors piled back into the safe-haven currency, while the Aussie, euro and Chinese yuan buckled.
MSCI’s broadest index of Asia-Pacific shares outside Japan ticked up 0.2%, recovering from Monday’s losses. MSCI’s benchmark index has gained 5% from the year’s lows but is still down 15% so far this year.
Just as investors were taking heart from a four-week rally in global equities that pushed markets to their highest in more than three months, Monday’s underwhelming Chinese activity data spanning industrial output and retail sales hit sentiment.
Also, U.S. single-family homebuilders’ confidence and New York state factory activity fell in August to their lowest since near the start of the COVID-19 pandemic, a further sign the world’s largest economy is softening as the Federal Reserve raises interest rates.
Overall, the picture was mixed across Asian bourses on Tuesday, with Tokyo and Taiwan benchmarks little changed, while South Korean stocks gained 0.5%.
Chinese stocks rose, a day after the central bank unexpectedly cut interest rates after data showed economic activity and credit expansion slowed sharply in July. The CSI 300 index ticked up 0.1% after dipping on Monday.
On Wall Street, major indexes climbed on Monday, reversing earlier session losses. Shares posted four straight weeks of gains amid optimism over a slowdown in U.S. inflation that could temper the pace of Fed rate hikes.
The U.S. economy contracted in the first and second quarters, amplifying an ongoing debate over whether the country is, or will soon be, in recession.
Growth worries were also the dominant theme in Europe.
Euro zone government bond yields fell on Monday with investors concerned about possible recession and amid persistent fears of production cuts in Germany due to potential gas rationing.
Fragile demand outlook hit oil prices as they extended losses from the previous session. Brent crude futures lost 1% to $94 a barrel after falling to their lowest on Monday since before Russia sent troops into Ukraine on Feb. 24. WTI crude futures shed 0.7% to $88.80 a barrel.
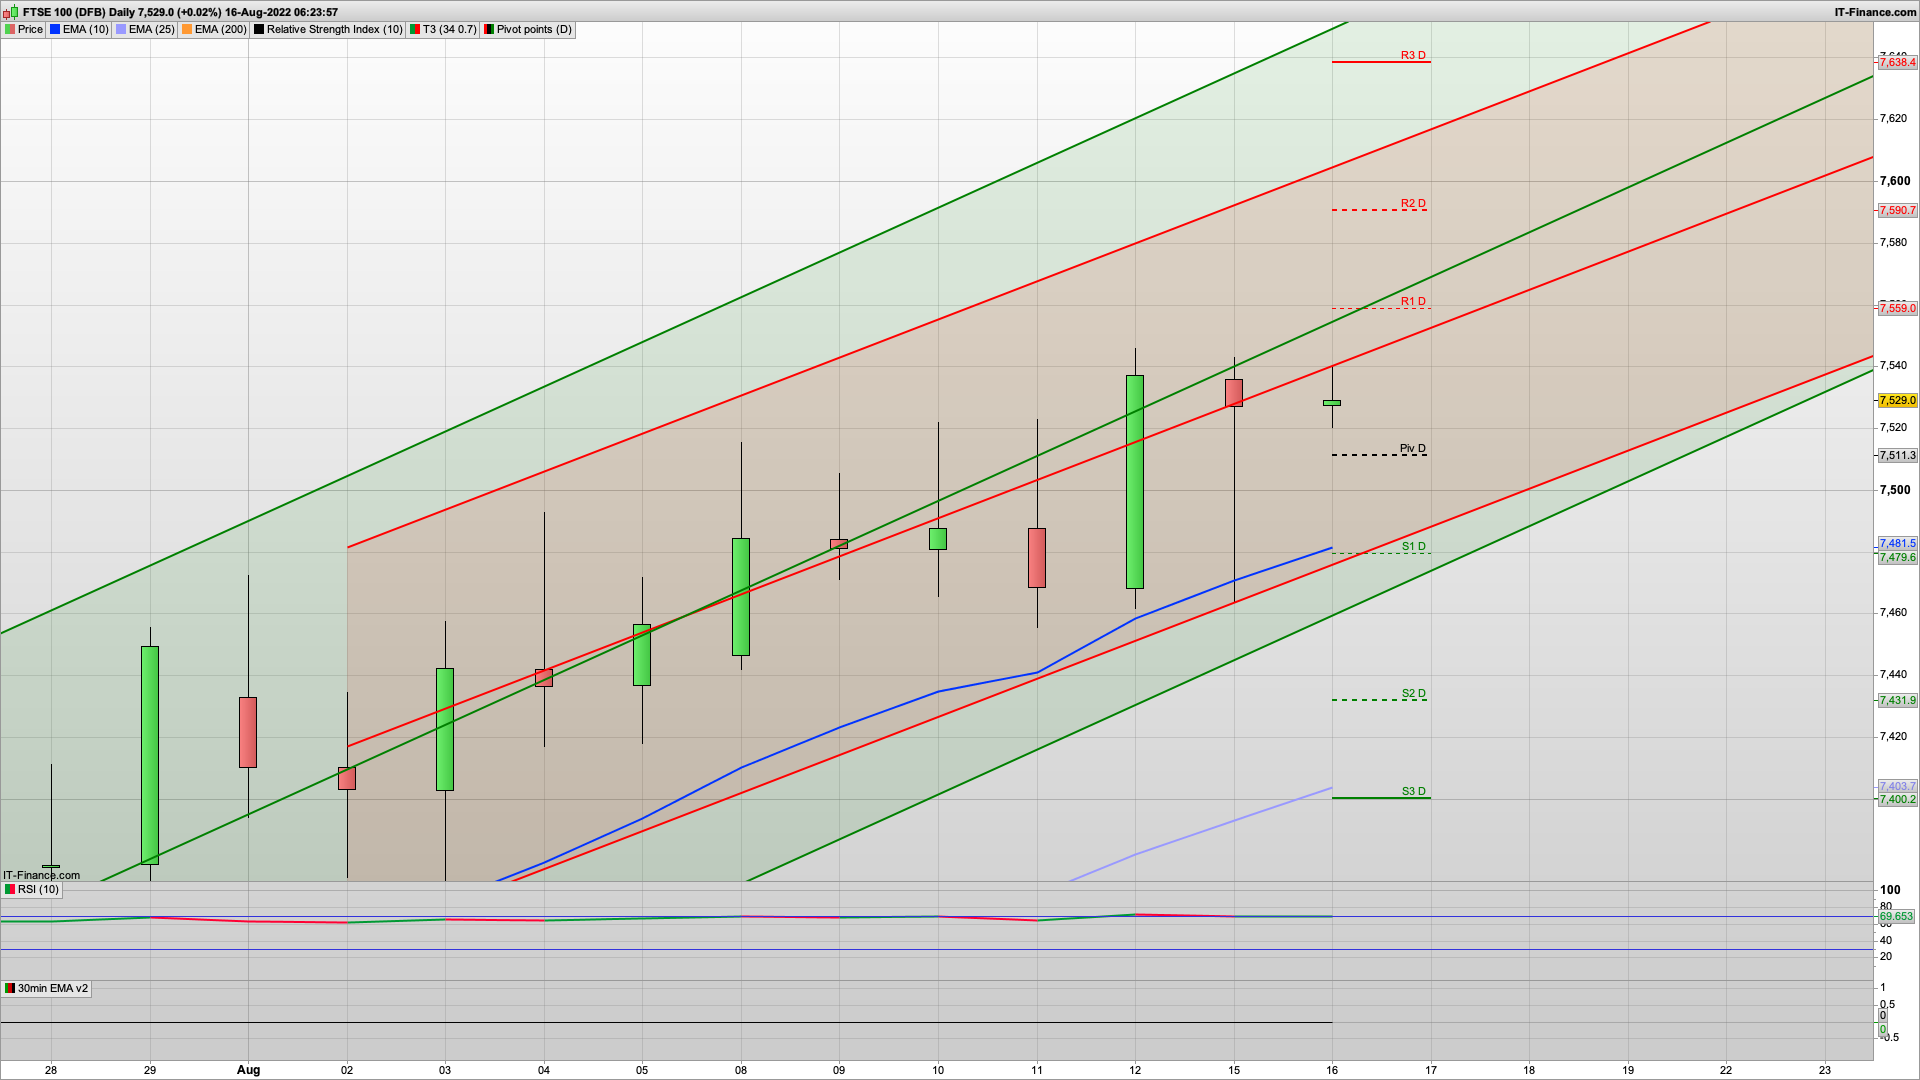
FTSE100 live outlook prediction analysis for 16th August 2022
The bears managed to break below the 7500 level yesterday but the 7466 support from the fib level held well to get a bullish bounce, as the S&P went for the 4300 level later in the day. A modest drop off 4300 tee’s up some further upside for today towards the 4330 level, and 4350 above that. That should in turn help underpin the FTSE100 today for a rise towards the 7590 level.
The ASX200 had a rise and dip play out with bear Tuesday kicking in during the latter part of the session, and the FTSE100 may well do something similar. I would like to see a rise towards the 7590 level, and possibly a test of the 7600 as things on the longer time frame chart remain positive. The Raff channels are still rising, the 2h is bullish, and the 30min chart has a green coral trend line currently.
Initial resistance is at the 7560 level where we have R1 and the key fib, so a rise to this first thing and then a bit of profit taking from the 7466 longs would start the day well. Above that then the 7590 as mentioned, with R3 up at 7638. Seems a big ask to get that high, but with oil continuing to drop we may well (in the short term at least) have passed peak inflation. We will find out tomorrow as the latest figures get released. Till the winter anyway when the energy prices will no doubt shoot up again.
For the bears, they will be looking to take it below the 7500 where we have the 30m 200ema, and then a retest of the 7466 level. A break of that may well see it slide as low as 7420, a level that may well trigger another bounce in this uptrend. Generally today though I am expecting a rise and dip to play out, rather than an overly bearish day (famous last words!)
S&P500
As mentioned 4325 and 4350 are the next resistance levels of note, while the 2h chart has support at the 4285 level from the Hull MA – we are just above this as I write so we may well see that help with the rise and dip playing out. A break of 4280 though (daily pivot) and then a slide down to 4253 and 4230 is worth looking for. Those are the next key support.
Good luck today.
Recommended Broker
IC Markets – offers market leading pricing and trading conditions by providing clients with True ECN Connectivity; this allows you to trade on institutional grade liquidity from the world’s leading investment banks, hedge funds and dark pool liquidity execution venues. Highly recommended!
Membership and Live Trading
If you would like more detailed analysis for FTSE100, DAX, Gold and S&P, including the trades that I am looking to take myself, then please join my active members community.
What you get
- Daily Analysis pre market open (sent around 7am each day) for FTSE100, DAX40, Gold and S&P500.
- Daily email pre market includes my trading plan for the day including ORDER levels, with stops and targets/limits
- Telegram live trading room and webinar group membership for discussion and realtime trade updates
Keep up to date with new content, free sign up below with just your email address