
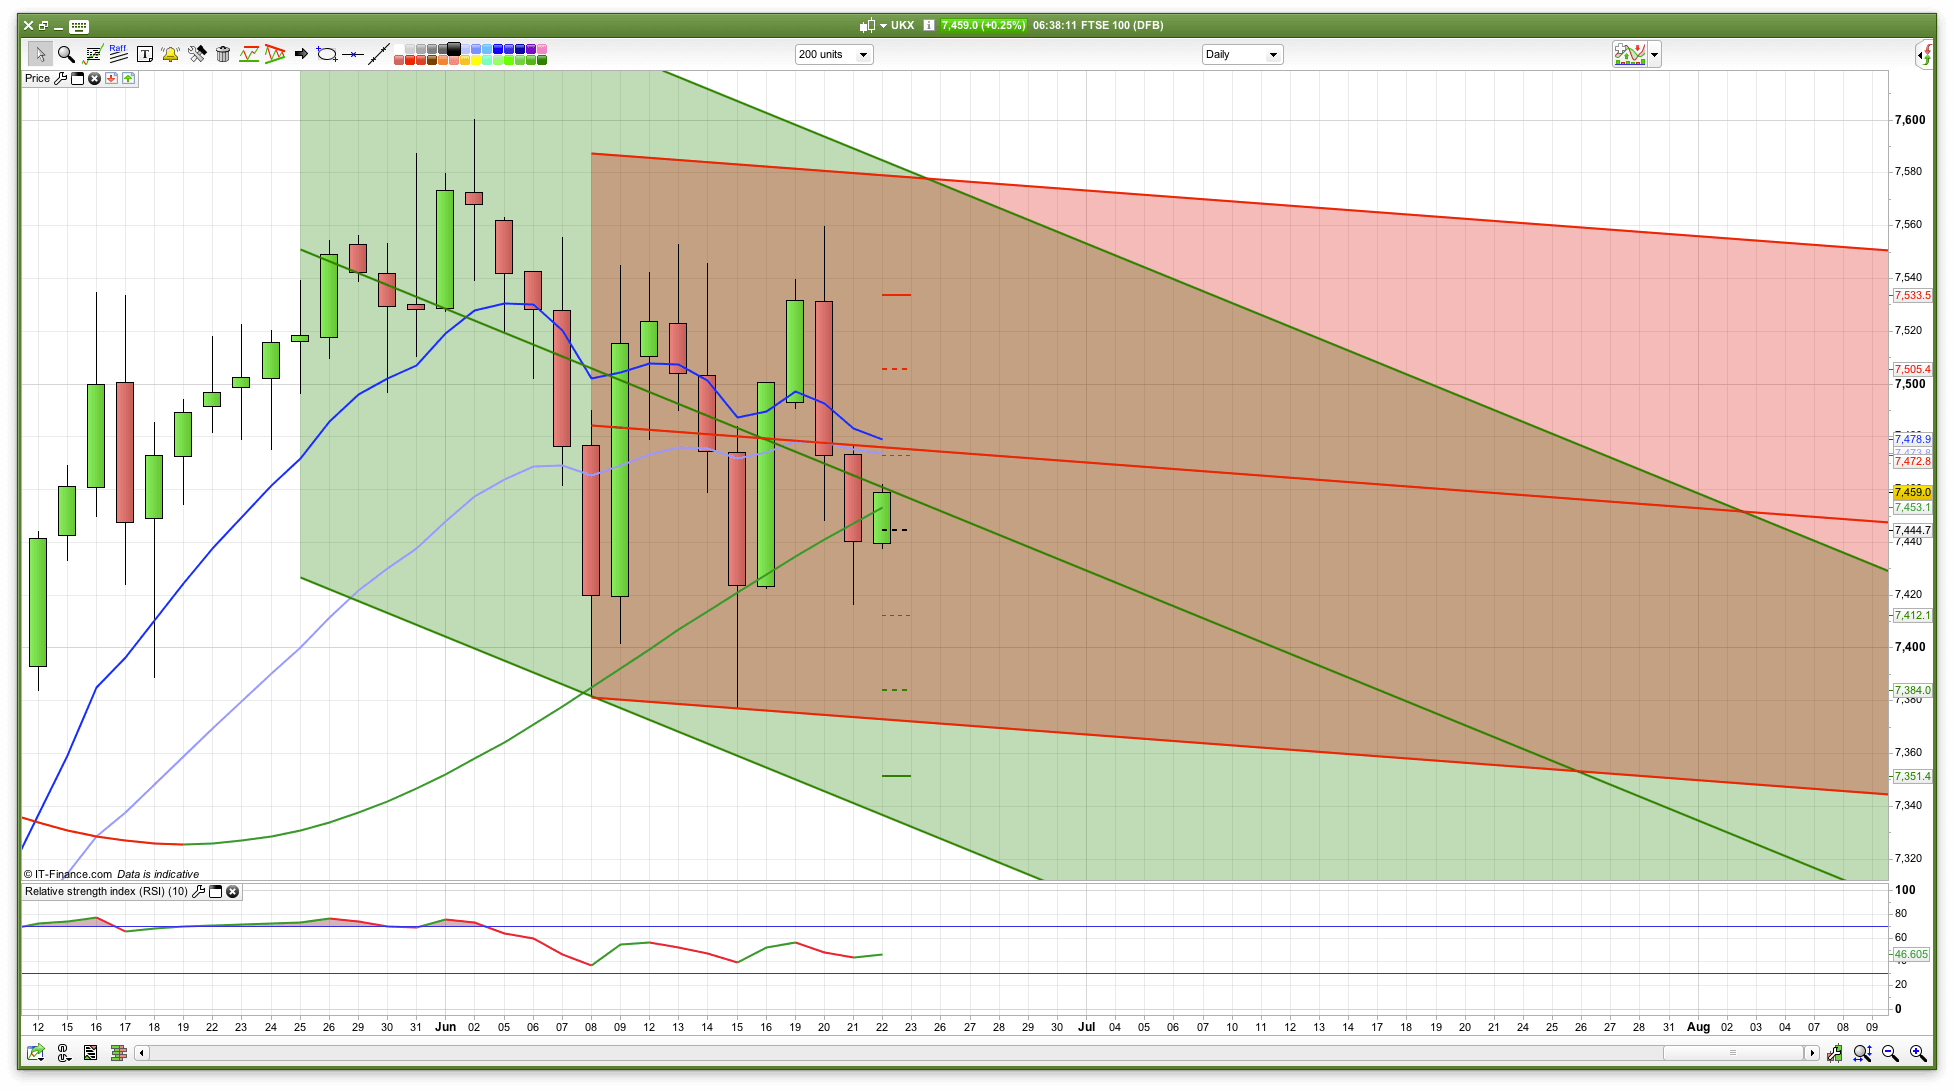
22nd June 2017
The 7420 level provided good support and the long managed to run to virtually 7470 before faltering. Overnight the FTSE has stayed up well, with it back to 7460 this morning. The bulls will need to break the 7480/7490 resistance area this morning to push higher, and of course defend any retests of the 7420 level. The Bianca channel bottoms are slightly lower at 7407 and 7398 for today. Oil continued to be weak, with Brent crude entering a bear market Wednesday, plunging below $45 a barrel for the first time since November. Gold has bounced from the lows yesterday – typically just tagged my stop at 1241 perfectly then climbed and continued overnight. Still, better than holding Ethereum which flash crashed from $300 to $13 in minutes overnight.
FTSE 100 Prediction
The ASX200 had a decent bullish performance today and I think that we may follow suit. The 7420 level held well yesterday and we have support at 7440 today. The key will be if the bulls can break the 7490 resistance area and if not then a test of the lows is possible. If 7420 breaks then we could be on for 7350, where we have the bottom of the 10 day Raff channel and maybe even lower.
If the bulls do break 7490 and we look like we are going to hold above that then we could be on for a bullish end to the week with a rise to test the 7600 level.
That said, the 2 hour chart is still bearish, with the resistance level at 7480 so any early rise might well encounter some resistance here.
Want more detailed analysis for FTSE 100, DAX, Gold and S&P? Then please join our active members community.
What you get
- Daily Analysis pre market open (sent around 7am each day) for FTSE, DAX, Gold and S&P.
- Daily email pre market includes my trading plan for the day including ORDER levels, with stops and targets/limits
- WhatsApp and webinars group membership for discussion and realtime trade updates
Long ftse 7410. Oil fall hurt ftse. Can see oil starting to move up from this low point
I’m running a 40% hedge on my long till dow open……it’s an insurance policy I’m prepared to pay for if its not needed….
We are 22 points above the 200sma on the closed Dow hourly…if it breaks the 200……???…..that will be interesting!!! And that’s putting it mildly….
Doubled up on shorts this morning at 7430. Stop to break even on the add and trailed my stop down on my 7545 entry to 7475. Close to the break lower here, think it could come this afternoon. No interest in buying this market until we see some supportive price action which I don’t expect to see until 7100-7200 area.
There’s no substitute for experience….thanks for all you’ve posted…
Tbh, I don’t like EMA on hourly and MACD as well (FTSE), and the price broke the trend line, no good. For me it suggests falls but not rises. Dow MACD is bearish but will it break 200EMA? As to Dax, it’s confusing but it got a bearish bias.
Hm, now I see bullish EMA on 10 min charts on all of them, FTSE is the weakest but will they break 200EMA?
I’m not sure whether my 7430 entry will hold at breakeven but let’s see. We’ve been making flat bottoms around 7380-400 with lower highs on each subsequent rally. We failed at 7470 3 times so it’s bearish below there, neutral in the trading range above. This morning at 7400 we got oversold on the hourly.. it’s difficult to break support when already oversold. What I’m hoping for is that we trade sideways for a few hours just above 7400 so that the RSI pops back to neutral, then we have a chance of the break later on. The further it rallies the harder it will be to get the break down. Once support breaks the algos will definitely switch to selling the rallies so it could accelerate lower. Think that would tally with the Dow and S&P breaking last week’s lows too so the outlook would definitely turn to bearish at that point.
It may spike though to 440, Dow and Dax are set for a spike.
Nice bounce off the 7398 10 day channel support
Closed short positions in the early hours.
Had a good long on oil which I have now closed.
Short FTSE at 30….not the best entry but it seems if a corner has been turned? it’s hard to revert you thinking and not be fixated by your initial opinion.
GL
Short term trend is down…7460 resistance
IG sentiment shorts now at 65% was 85% last week..
Strategy is to short the pop ups
Hey mcgcapital, are you based in London?
No in Sheffield… I worked in the city until about 6 months ago then jacked that in to focus on this full time, moved back north in March
You are not far away, I am in Bolton.
And then there were three……I’m in the North West too….
🙂 well I am way up North, Edinburgh
Looks like we got a club here, ei!
Ftse shorts closed
Decision time.. neutral RSI and potential topping on the 5 min with not long to go until US open. If this is going to be another lower high we’re in striking distance of the support area this time
Got stopped at 7430. Back in at 7427 stop at 7437 this time. Still looks toppy to me as long as this area holds
Tbh Dax and Dow made higher low, we could be in uptrend again. Maybe God heard anstel?
For me the risk profile of the market is still skewed negatively. Here’s what I see:
1. 6 week long top building process around the 7550-7600 area. Each time we sold off and then reclaimed 7500, the time spent between 7500-7550 got shorter and shorter. Which is a sign of a weakening trend.
2. Flat base holding at 7380-7400. Think this morning was the 4th test. Each time we’re bouncing off there the bounces are travelling less and less far. Which is another sign of weakness.
3. Since we broke 7480-7500 area on Tuesday we’ve tested 7470 3 times and sold off each time. So think the first step for bulls to change the trend is to reclaim that area.
4. Seasonally weak period in the calendar. The week after June opex has been down 13 out of the last 14 years.
5. Relatively long period since a drawdown of 5% in the S&P500. We’re on 150 odd days now and that’s the longest since 2013, so you could say we’re due one.
6. Fed just raised rates and the previous times have coincided with at least 2% drops in the S&P over the next few weeks.
So basically technicals and other patterns are aligned to the downside. I can see oil falling further here too before a sustainable rally. Support seems to have given way and commodities tend to trend quite well. Obviously depends on OPEC interference but they’ve only just had an output freeze so probably nothing coming short term.
Overall, bigger picture it’s difficult to see much upside unless 7550 is broken. But I’d become significantly less confident it’s going down if we managed to push back up into the 7500s again given the way we’re set up.
I’m not looking for a collapse as I think the bull will continue. But just see the above as meaning that if/when 7380 gives way it could get pretty messy and 7100-7200 is definitely possible.
Also should add.. I’m looking at patterns and probabilities to try and get an edge. It doesn’t mean it’s definitely going to tank, I’ll switch bullish if it sets back up that way. But at the moment it’s showing that bears are in control of price with some downside potential ahead, so it’s for bulls to prove otherwise not the other way round. The break of 7380 is the key to it all.
I don’t know where the price will go and it never bothers me. I trade daily set ups. But it is interesting to speculate on that. There’s an uptrend line still and if it breaks 7330 then yes it will go lower, cannot predict where, but I see several supports like 7250, 7100. Nick will know with his Bianca and Raffs. Out of all indices Dow is the most bullish atm and FTSE is the most bearish: EMA on daily crossed for downside already and MACD is falling everyday but not 0 yet. But uptrend is still holding and may snap out of this Short set up many times. Although it only retraced 38% and may get lower though.
I basically use pivots which on the FTSE always seem to be 50 or so points apart. Have 7090, 7130, 7190, 7250, 7310, 7340 and 7380 below the current trading range. The bigger picture range at the moment is 7380-7550, 170 points. So generally speaking a break of the range might be expected to have a measured move of a similar size which takes us towards 7200. It’s all about what happens when 7380 breaks, it looks pretty important on the chart so I’d be surprised if we only fell to 7340 say, then went straight back up. Just going to let price lead and see how it reacts when things happen. Thinking it would bounce from the low 7300s if we get there but it’s just speculation at this point
Yes, we will see how the next couple of weeks unfold.
Also would add that the close is quite important. Lots of the big breaks seem to happen right on 4.30… so for 7380 to go I’d prefer to see either a big sell off in the first half hour where we take it out or one where we look weak all day and manage to close under it with a last minute sell off. If it just kind of drifts down and gets there at 11am with an oversold RSI there’s a good chance it holds and rallies. Kind of like today – I got a bit emotional hoping it would go but in hindsight with that set up I should have covered the trade, so poor execution today.
Examples of those important moves at the close are the last couple of weeks where we’ve broken 7490, the break of 6930 in October and the break above 6220 in April 2016. Those kind of set ups I’ve never seen fail but they don’t come along all that often
Hi all, had a good week so far, picked off a few shorts on the Dow. And currently short 400. Happy to use as a long timeframe trade if need be.
As for the geography chat It looks like I’m the obligatory southerner here in Kent. Have to form my own lonley group. Lol GL all
Don’t like this. Dow
We could have another leg down before it snaps back up
McgCapital, what’s your take on the Dow? Do you trade it?
Looking at the daily chart we had a full on bull run since early November with a little time of range trading then again a run up to where we are now.
The rsi daily is sitting close to the 70’s and I reckon the trump novelty has worn off by now. Downside to come? Can’t keep thinking about Anstel warnings “don’t trust it as far as I could throw it. ” lol
I only trade FTSE because I prefer to be able to remember exactly what it did and when, and if I did multiple markets I think I’d confuse myself! However, I also follow the dax, nikkei, all the US indices, gold, oil and rates. Just couldn’t tell you the exact levels for support and resistance.
As you said, Dow is basically in a straight line uptrend.. the last 2 days have been the first signs of weakness for months. If my FTSE trade comes off I’m expecting everything to correct at the same time so 4-5% off the high looks reasonable. Usually I’d look at the chart to see where the support levels are in that vacinity but given it’s gone straight line up there’s not been an awful lot of back and fill on there. I guess the 20400-20500 area looks like it would bring out strong buying given that’s where it turned in March/April time but got no idea if it would get that far
It is very interesting, in 2016 it was 15500 and now 21500 on Dow. 39% rise since last year. Wow. I think it’s as good as it gets. It cannot pump up forever. Looks unrealistic that chart. Does it have guts to push to 24000?
Selling into the close on Dow..,umm a change of tack or a bluff?
See what the Asian market makes if it.
I’m short in sp500 only
Anstel …how you getting on chap.?
Evening chaps,been busy today with other responsibilities……ive been monitoring the situation…….I’m in defensive mode …..running hedges …and looking for clues as to short term direction……my view is we havn’t seen the end of 7500 and above at some point but where it will go next is anyone’s guess……it doesn’t seem to want to go up that’s for sure…….it’s challenging ……so let’s see how this plays out and whether I can achieve a satisfactory outcome……
I took major hit last few days.
I added my largest short yet to sp500 39…and I’m in blue but need a lot more downside
Careful. A snapback is due
I thought you where on the page of a correction.
Whare your take, some say hard fast others gentle????
Signs point to a dip, hoping for a Friday sell off!
….what’s your take
Absolutely! I am favouring a sell off. But the timeframe is longer. Yes the daily is a little stretched but it is certainly due a pullback. The price action feels like it. No problem being short but just be careful of any sudden upward movements