
Support 6049 6042 6030 6029 5943 5932
Resistance 6068 6072 6103 6194
Market Summary for 29th February 2016
Both the shorts worked well to give a decent end to February, with he first short taking on the spike with the Chinese rate cut news.
European data got the markets off to a negative start but then moved higher after China said it would resume its easing cycle (meaining banks could reduce their margins held against loans).
The FT100 spiked down below 6050 in the morning but regained that level after the China news fed through.
On the Wall Street open shares rallied further taking the FT100 to the 6100 area at the close.
This appears to be a level of high resistance so there is still a good chance of a fallback to below 6000 in the coming days, especially with possible Brexit unsettling some investors.
US & Asia Overnight from Bloomberg
- Chinese lenders’ reserve ratios cut amid deepening slowdown
- Crude trades near seven-week high; ringgit strengthens
Asian stocks rallied and emerging-market currencies strengthened as monetary stimulus in China brightened prospects for the world’s second-largest economy. Crude oil traded near a seven-week high, while copper led declines among industrial metals.
Benchmark share indexes advanced across most of Asia after the People’s Bank of China cut lenders’ reserve requirements, helping lower borrowing costs in the nation. The yuan gained for the first time in eight days and the pickup in oil prices buoyed Malaysia’s ringgit. Copper retreated and gold rose after a gauge of Chinese manufacturing declined, matching its lowest level of the past seven years.
While February marked a fourth consecutive monthly decline in global stocks, a benchmark equities index rallied more than 5 percent since Feb. 11. Mounting signs that American consumers can still power the world’s largest economy and hints from central banks in Asia and Europe that more stimulus is at the ready underpinned the revival, along with crude’s rebound from a 12-year low reached last month.
“Market sentiment is on its way toward a recovery, but the slightest bad news can still rock it,” said Toshihiko Matsuno, chief strategist at SMBC Friend Securities Co. in Tokyo.
The cut in Chinese lenders’ reserve requirements is the first in four months and comes after Asia’s biggest economy expanded last year at the slowest pace in a quarter century. The nation’s parliament will gather on Saturday for an annual meeting, where plans for 2016 and the next five years will be outlined.
Stocks
The MSCI Asia Pacific Index rose 0.5 percent as of 2:44 p.m. Tokyo time, headed for its biggest gain in a week. Hong Kong’s Hang Seng Index added 0.3 percent, while benchmarks in Australia and Taiwan rallied 0.9 percent. The Shanghai Composite Index gained 0.2 percent, though is still down 24 percent for the year.
China’s $5.3 trillion stock market will rebound as much as 20 percent in the “short term” as economic growth picks up and yuan volatility decreases, according to Lirong Xu, chief investment officer at Franklin Templeton’s money-management unit in Shanghai. That view was echoed by Gao Ting, head of China strategy at UBS Securities Co. in Shanghai, who said sentiment is “overly pessimistic” and there’s a growing chance of a rally within the next three months as the central bank loosens monetary policy.
Standard & Poor’s 500 Index futures slipped 0.2 percent after the U.S. benchmark retreated 0.8 percent on Monday, capping a monthly loss.
Currencies
The yuan strengthened 0.2 percent versus the dollar as the People’s Bank of China raised its daily reference rate for the first time in a week. An official manufacturing purchasing managers index dropped to 49 in February, missing the median estimate of 49.4 in a Bloomberg News survey of economists. It hasn’t been weaker since January 2009.
“With a stronger fixing, they’re trying to ensure a stable yuan even as they ease policy through the reserve-requirement-ratio channel,” said Khoon Goh, a foreign-exchange strategist at Australia & New Zealand Banking Group Ltd. in Singapore. “There’s potential for further RRR cuts, given that today’s PMI data was weak.”
Malaysia’s ringgit strengthened 0.3 percent versus the dollar, climbing for a fourth day as the rebound in crude prices brightens prospects for Asia’s only major net oil exporter. The Australian dollar fell 0.2 percent after central bank kept its benchmark interest rate at a record-low 2 percent at a Tuesday policy meeting — a decision forecast by all of the economists in a Bloomberg survey — and said low inflation offers scope for easing.
Bonds
Money-market rates declined in China as the cut in lenders’ reserve requirements freed up funds. The one-day repurchase rate, a gauge of interbank funding availability, dropped four basis points to 1.94 percent in Shanghai, while the seven-day rate was seven basis points lower at 2.27 percent.
U.S. Treasuries advanced, pushing the 10-year yield down by two basis points to 1.71 percent. The securities have returned 3 percent in the first two months of this year, their biggest back-to-back gain January 2015, according to the Bloomberg World Bond Indexes.
Commodities
Crude futures rose 0.2 percent to $33.83 a barrel in New York, after gaining 3 percent Monday to record the highest settlement price in seven weeks.
Copper, nickel and zinc all fell at least 0.9 percent on the London Metal Exchange, dragged lower by the deterioration in China’s manufacturing. Gold climbed 0.4 percent, building on an 11 percent jump in February that marked its biggest monthly increase since January 2012.
“Chinese growth concerns have boosted the safe-haven appeal of gold,” said Bernard Aw, a strategist at IG Asia Pte in Singapore. Gains may be capped on Tuesday by the “short-term boost to risk appetite from China’s easing,” he said. [Bloomberg]
FTSE 100 Outlook and Prediction
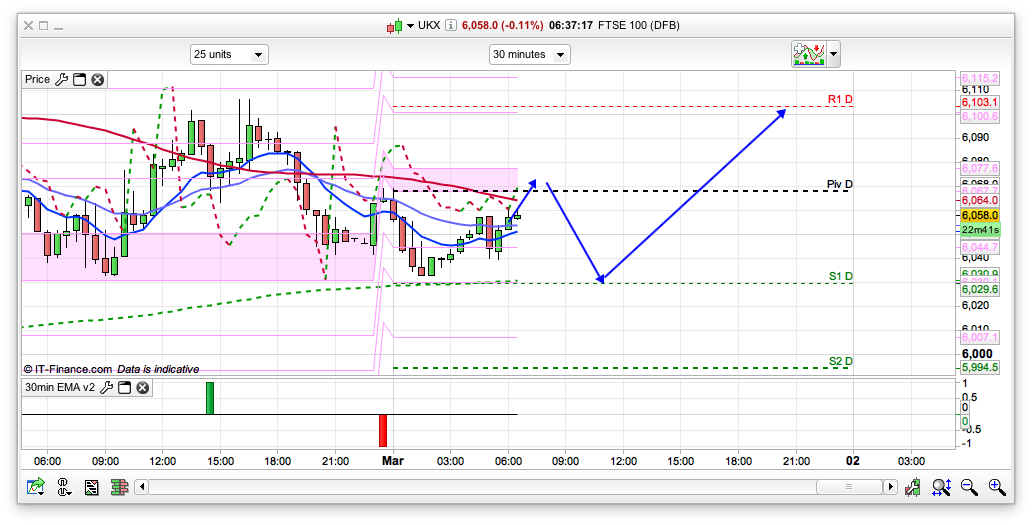
For today there is initial resistance on the 2 hour chart at 6072 after crossing to a bear scenario overnight, so it will be telling to see if the bears start to appear at that level for a dip down towards the 200ema at 6030 on the 30min chart. Despite that rate cut news yesterday the bulls were hardly able to make it climb loads, and then with poor Chinese factory data overnight and further stimulus talk helping Asian markets, the FSTE has stayed around the 6060 area from last night. One again it looks like stock market growth will come from stimulus measures rather than a solid foundation. Kick that can a bit further once again! I digress. If the bulls manage to hold an early test of the 6030 area then I think we might see a bit of a bounce from there, mainly as the daily chart is still positive and the Raff channels are up at the moment, though I must admit I am feeling slightly more bearish than bullish at the moment, especially since we didn’t recapture 6115 yesterday which we saw on Friday (6110 was the 10 day Bianca high on Friday), so while that 10 day channel is now at 6194, the bulls are not really pushing on. Probably a bit early for Brexit worries, but that will be a factor in some sluggish moves. So, fairly simple plan really for today, initial dip from 6072 then bounce at 6030. Lets see if it plays ball!
Well it is not playing ball. I had similar plan and shorted DAX 9475. Losing my shirt at the moment big time and I really have no clue why we up this much. Any ideas anyone?
Or maybe just climb from the off on delayed reaction to that PBOC news!
6141, then 6194 looking like resistance
Would think the climb due too China data missing investor rubbing their hands …. More stimulus
That news was out like 5 hours ago! Jesus have global markets just become 8.15am to pissin 4.30pm now?
Morning Dutch – I think this new month rally is just gonna last for a few hours and I am expecting a pullback as well but not too much.
We should be back to 6100 FTSE and 9500 DAX before DOW.
I am looking for a long around 6100 area for now.
I think buy the dips should work today but will only short if we can get to 6150-6160.
Also, as we have broken 6130 resistance so I think FTSE will try another go at 6300 area before brexit!
Currently short from 6150 half out at 6125.
GL
Morning All,
Was Trading ASX 200 last night and it has the similar movement for new month rally.
I am expecting a dip to 6100 again shortly and then back to 6150 by this afternoon.
GL everyone
Dutch calm down…
Calm alright, just severely scratching my head. I was kind DAX 9375 and closed this out 100 points higher. Realising the rise was a bit unsubstantiated and this China data plus subsequent pboc news seemed to drive markets lower. Then in 20 minutes time it goes to 9650! So we have had a swing of 300 to 400 points and it is just silly. Maybe I need a break…
Can anybody remember enough Super Tuesdays to have an opinion on the U.S this afternoon re that please ? quiet,active ?
FWIW
http://www.cnbc.com/2016/02/26/super-tuesday-is-often-a-bottom-in-the-stock-market.html
Hope you are £1 pp.
Morning chaps.
Well, saw the writing on the wall with that pre market so said goodbye to Brian my big short (and several thousand pounds) at the opening and went long to 6130 and out.
That’s it for me with longer term specs, won two lost one in the last year, nett result minus £2k but plus mucho stress. Zero sum game.
Scalping the rent money isn’t very red braces but it’s what I’ve been good and and comfortable with, and despite my best efforts, a large position in the background does cloud my approach to it.
This maybe a convoluted bear trap, if so it’s succeeded for me, and as long as 5900 maintains then the next goal would be a higher high to around 6200, where things will be getting a little overbought, at least on the daily if we go straight there.
The whys and wherefores of all this are moot to say the least, and fwiw I remain bearish on the global economy until, as the G20 hoped for, some form of structural change comes about, but that is a real wishlist item.
At least my bitcoins are still going up. 🙂
6194 is the 10 day Bianca channel top, worth a short here I reckon
Morning!
Sorry to hear about Brian. I was wondering how you were doing with that short.
So far I feel most comfortable watching the price action on the 5-minute and 3-minute charts, then capturing relatively small movements. I don’t know if it’s just down to luck, but I have been doing okay so far. I just look out for doji candles during an upward trend, then a following lower-closing low before going short (one of the triggers I read about in John Person’s book). I’ve also watched a few occurrences of this whilst not entering trades, and they would have worked out as well.
Unlucky tmfp, sad to see Brian go, I think we all grew to know and love him. Dave on the other hand (my short) is still puffing and straining (and costing). When I got back last night and had a look at the World it seemed to me to be all a bit messy, how wrong can you be. I was kind of expecting to see Dave well in the money at around 6000!
NO! Release Brian!
Bring back Brian! Bring back Brian!
Who is Brian?
Hi tmfp,
Unlucky but I do think longer term positions are best chance of making big money.
Quite likely RJ.
Just as well that “big money” isn’t really my goal, a couple of grand a week and the weekends off will suit me just fine….
🙂
I would be happy with couple of grand a week tmpf, you are too good at scalping so no need to hold it longer term 🙂
RJ, me too. 2 grand, bring it on! 🙂 100 points per week for £20pp, quite reasonable.
I remember you mentioned a 1000 points rise to 10000, seems happening.
Morning all,I like the way the Chinese estimates = the previous and both miss by 0.4,there is something traditional and sophisticated about it,thousands of years of govt figures and an acceptance that it is all just symbolism.Much better than the western way of pretending numbers are reality,when everyone knows they arent.
Well on the brighter side just finally close my Dax long from a few weeks back, I brought the day before the big sell off but because the position was small added on the way down which made me a nice profit, then after last weeks cock ups left me a few quid down. only have my small medium short on ftse, which i will be holding. GL folks
Morning everyone.
Only one trade for me so far today – a 3.3-point gain with an early FTSE short.
With the pre-open level appearing to be hanging around the level of 6078 (which coincides with the figure I have for today’s pivot point), and the FTSE open called to be 6052 (which coincides precisely with the figure I have for today’s S1 level), AND taking into account the generally negative overnight news (according to my interpretation – USA down last night, China PMI down, Europe inflation down, crude oil down slightly), I thought it was likely that there would be a swift fall from 6078-ish upon 8.00am open down to the predicted 6052 open in the first few minutes.
As it happened, I went short at 6077.8 at around 7.50am. After going up just before market open, I was disappointed to find that the market didn’t open at 6052, but 34 points higher at 6086! Although the expected initial fall happened, it was clear that it didn’t have much momentum and was being countered with green candles, so I exited at 6074.5 for a 3.3-point gain.
I’m not quite sure what to take from this lesson, but I suppose it was a positive outcome, if only 3.3 points. I’m not sure that my pivot point figures are correct as they are different from the ones Nick uses on his posted chart image. For the daily pivot point (and R1, S1, etc) I use the figures from yesterday’s FTSE close at 4.30pm. Is that incorrect? Should I be taking a different closing time for the calculations, such as the after-hours close?
Anyway, good luck today everyone. I’m going to watch the price action for a while now because I can’t work out what’s going on.
Hi FGS
Cash Market Pivots – livecharts.co.uk/Members/display_stock_pivots.php
I think Nick is using the IG pivots – slightly different to Cash Pivots.
Thanks for that! That would explain why my figures are different. I’ll have a look at those ones now.
Thank you for those Hugh, nice overview, like that.
Their automatic pivot point calculator is very handy.
I looked at their pivot points and the standard pivot points are the same as the ones I worked out, so I presume they use the 8.00am – 4.30pm period as well. I can also see that the Fib Pivots and Cam Levels figures differ somewhat from the standard pivot points, and that’s fair enough, but I don’t understand how those available choices contribute towards achieving some level of predictable price action.
If I’m looking at my standard pivot points in relation to market price movements, and attempting to make trading decisions on those levels, surely the Fib and Cam alternatives are also being looked at by other traders to some significant level and are likely to result in movements with no correlation to what my pivot points might suggest.
What is the sensible approach to this? Should I be noting all the alternative price points and levels for the alternative calculation methods, then expecting that something might happen at any one of them? In my book (‘Candlestick and Pivot Point Trading Triggers’), it is implied that one can expect an element of predictable price action according to the standard pivot points, but surely (just guessing) in the real world there would be something approaching an equal number of people looking at each one of the different sets of figures.
Hi FGS,
I read your post about daily targets to recover your losses. I don’t see a S/L strategy in your plan. Do you have one ? If you don’t better to plan on exit strategy or else I can guarantee you will lose all your small gains in one trade.
Good Luck !!
Hello RJ
Thanks! I forgot to mention that. My stop loss strategy is relative to the trade entry trigger that I’ve been reading about, which is to have a stop a couple of points above the previous high (assuming shorting), and vice versa for longs.
Admittedly I haven’t used automatic stop losses, but I’m watching the whole time, so will activate them manually instead. I’m aware of the potential psychological pitfalls there, but in practice I don’t deviate from my original plans (famous last words I expect, but I’ve been good so far).
Hi FGS,
It is similar to what I use but I always use automatic stops and it goes in, as I place the trades. Exit strategy is very important. All the best !!
Thanks, yes, I ought to look at automatic stops really, just in case!
Watching all the time does not guarantee you will manually close the trade. Sometimes the price goes through your virtual stop loss and you are chasing since then. I need to put stops but also fail thinking like you and then can’t stop chasing. It sometimes leads to losses or lucky recoveries. RJ is very much right about automatic stop losses.
Sticking to commodities. Short cotton, long cocoa and silver. Will short FTSE later if it gets to 6190. These indices are driven by central bank news and you never know when it’s going to happen.
Silver………plenty of M word going on there
Morning Chaps,
Well that was a bit of a kick in the ribs to start the new month.
I often wonder if it’s worth trading 7 O’clock & the open.
The market is just setting up during at this time.
Parabolic – enough said.
Holding Short 6106 – (+ losses) so need a decent plunge.
Trio at (S) 6134 (8:30 – 8:40) – momentum pushed it a tadge higher.
Would have been a 3:1 approx Stops 10
MACD Sig and RSI at 9:12 Approx (L) 6110 – Let’s see how strong this move is .
Bernut would say do it,but change the stake I think.
Good morning everyone!
First post on here, I trade ftse only, using only two methods which have served me well over the last decade, I do not trade full time as work aswell and for the last 2 years via my phone. I use the 9/30 crossover on 3min or 10 min, and /or I watch for rapid price movements and jump on catching usually 3 points or so at a time till momentum slows in any given direction.
Very basic I know but fits in with limited screentime as it were.
Anyway that’s me, some great comments on this page which I flick over to throughout each day. GL to everyone!
Hello SteveJP
I’m new here as well. It’s interesting to read about your method. As a beginner I think I’m leaning towards a method similar to yours at the moment, although I’ve been watching for the end of those kinds of movements and catching the reversal after it shows signs of changing direction.
Good luck!
Hi FGS, I admit I am not clever enough to pinpoint reversals other than using the crossover and of late that method is left wanting so I watch for breakouts of consolidation and jump on catching a few with stops always and banking everytime it slows down in movement of that makes sense?
Yes, that makes sense. I was looking at the moving average crossover method, but it seems that for the price movements I’ve been looking at, they’re largely over by the time a crossover signals a trade – or even not actually crossing over whilst the candles themselves suggest a viable trade.
I get exactly what you mean, though on 1&4 hr they are pretty reliable in days like these but patience pays off on the larger time frames
Ahh, that would explain it. Most of the time I’ve been looking at 3-minute and 5-minute charts, with occasional reference to the 15-minute.
I think in Nick Hilsden’s strategy article he mentions 30 minutes and above for the crossover method, so that’s probably why I can’t use it!
I mostly use 10min, 30min, 2hour and daily charts
Okay, thanks!
stevejp, you are right, it’s better to catch some with the tide than against it. Don’t try to catch reversals.
Hi jack 2, yes I’ve spent many years and £££ trying to be clever!
I usually just wait for the market to settle for 30 mins in the morning then see if we are above or below 50 and look at the short term trend, if it’s got some speed to it (at this time I watch price only not the chart) I will jump on with a right stop and invariably always get between 3 and 10 points, as soon as it slows/stalls I’m out. Apologies if my approach is like mails down a blackboard to some but it works for me and I feel calm trading this way.
Hope this gives a little more clarity
I am also a scalper due to lack of time. And I use crossover of certain EMAs and wait for a momentum when the price starts going. But I generally aim for 20-30 points and more on Dax. Good market, recommend. I used to trade FTSE but it’s so slow that I could only drag 10 points at the most so started looking elsewhere. Dow proved to be too harsh but clear charts but burnt a lot.
Morning All,
Still holding the long from 9143 on the Dax, still looking for 10K. My added longs got stopped out b/e just left with one position. Roller coaster indeed holding long term positions and best not to watch it often. Will try to add to any dip but looks pretty much it won’t see 400s before 10k
Resistances before 10K 673 (just hit), 752, 843, 945, 973, 10026 – Not exact values but levels around there from past data.
Hi RJ, well done for holding on to those. I was long overnight on the DAX and added to it when it went below 400. I got out as it rallied a bit pre market and felt it was not going to get over 9550. How wrong can one be!
Staying short now and adding to them around 700 level as I don’t believe in such short term fairytales
Hi Dutch,
I agree, I wasn’t sure that’s why didn’t add any positions but just wanted to hold that original position as it looked like a bottom for short term.
I don’t prefer adding when in Red as I don’t have deep pockets. The market could still retrace. Good Luck !!
there is always US economic data to spoil the party!
then I think we will see 16800 on the Dow today.
Could well test 16800 but then again it could well test 16400 🙂
Pretty sure now the DAX is going to have a crack at 700 so I’m getting some big guns out to shout it down and add to my short. Currently short average @570 and I’ll have to ride it out till sense prevails which I hope will not take as long as you seem to predict!
What time is the data ? Looking at the charts, Dax might retrace to 580-60 area before 700. We will wait and see. I don’t think we will see 16400 on the Dow before 16800.
Don’t understand why we are at 6133 when there has been no real positive news. We should be around 5900 IMO as there has been real good news especially after the weekend g20 meeting.
Tempted to stick a long short on for a few weeks and see where it takes me.
This is the kind of thing that makes no sense to me either. I can’t seem to predict what the market is going to do based on news stories. It seems completely random, and is especially confusing when we gain sizeable gains off the back of negative news.
I seem to be able to predict things more accurately simply by looking at previous price action and ignoring new stories, although I haven’t been doing it nearly long enough to determine whether this is simply down to chance or if there’s something in this approach.
I do the exact same thing. I don’t follow news or assess economic conditions, I leave those stories to the experts, I just follow price. PA works way better and you will need a lot of screen time to acquire that skill. I can read price action with my own understanding but it’s very difficult for me to explain as I have not learned it from any books using standard names. Funny enough I give the candle setup formation my own name 🙂
Hi FGS,Stats and averages,with a 70% win rate you have an 11% chance of 5 wrong trades in a row over 50 trades and a 99% chance of 2,There is a chart for this,think I got mine from Bulkowski’s site.
I can’t find that chart on his site, but that’s a very interesting site! I’m going to have a read through that when I’ve finished reading my book.
It must be in one of the articles,its just a useful version of
http://mindrighttrading.blogspot.co.uk/2012/10/estimating-distribution-of-consecutive.html
Thanks for the link!
Long short!! Haha
I meant a short over a long period. You get my drift haha
This is more of a note to myself – but someone else may get something from it…
I just wanted to look at the subject of STOPS as this morning was a good example.
A TRIO Signal (RSI 6/17 & 31 all converged above their levels)
A SHORT was actioned at 6134 with a STOP of 10 – this was hit at 6144.
However as a little time passed, it perhaps becomes clearer, there is a DOJI on the 1 min & probably on the 3 min & 5 min.
This might have confirmed that this could be a good entry and another SHORT actioned – this time at 6138 – again with a STOP of 10 points.
This delivered a 3 : 1 RR trade.
So how I am viewing STOPS is that they aren’t necessarily a way of reconciling that a TRADE was “wrong” but rather a way of exercising some control of your account.
Similarlary at 9:13 am – MACD and RSI would have suggested a Long signal at 6111.
There is no way of knowing if this is “good” signal or “bad” signal.
The only way of determining this is by using a Stop.
If the position is Stopped – then it provides the opportunity to re- assess without being
unduly effected by other thoughts.
Any thoughts ?? – please add..
http://ec.md.it-finance.com/ProRealTime_V10_2/display_chartimage.phtml?name=udtvysc7l0j03gqakvpcz59a1&type=png&purpose=file
http://ec.md.it-finance.com/ProRealTime_V10_2/display_chartimage.phtml?name=e97pk2mqyzmahzgucobdepvzf&type=png&purpose=file
Hi Hugh,
STOPS are the most important aspect of trading. Anyone ignoring this will learn its importance in a hard way.
Outcome of any one trade is random and that is why you have to take the trade everytime you see the signal with pre-defined stops/risk. This stops you from second guessing and act more like a machine. It needs a lot of practice.
I have this now whenever I see the signal, I don’t think I just take the trade with stops. while I’m anticipating the signal formation, I workout position size and stop placement and as soon as the anticipated signal is formed I execute the trade. I don’t care about the outcome as it is random with my risks defined.
By following this approach, I have also learned to hold trades showing in profit for much longer. This helps to grow your account faster and also much more relaxing. I feel restless when holding anything in Red but more relaxed when I see blue ink just like watching the sky.
Yes Hugh I think so,money management and Trade management,both, that other Bernut thing you linked me to,S/L as a function of the timescale and the stake,so with the trade RJ describes where the added Longs got stopped out that is like a Reverse Martingdale on one position,which is the Bernut bit.He added to the trade as it moved with him and then let it cut its size back when it came back because it was a longer term trade he is managing to maximise profit.An a.m scalp in volatility would be smaller stake and tighter S/L where the S/L would be R/R based.S/l’s only go wrong if you mix timescales eg confirm the 1 min entry on a greater timescale but dont move the 1 min S/L to a greater timeframe position if it was a 1 min entry or we are just trading against the trend because we are denying a loss or a mistake in judgement.I think that is true on all timeframes,crazy that people take 5 min trades and wind up with a S/L off the mthly chart and saying the trend has to change because of some possible Fundamental event,weve all done that and it is bad gambling not trading.
Thanks WSF – What is the Bernut link – I’m not sure it was one of my mine – doesn’t ring any bells ATM !
Sorry Hugh and probably sorry Anstel,Better System Trader ,so I thought it was you because I know we talked about that once.His essays are worth a read too.
http://bettersystemtrader.com/032-laurent-bernut/
Hi WSF….I’m trading from a distance today getting on with some other jobs and just keeping an eye on the markets movements….not been closely following the forum but I will have a read up later on…..best of luck.
Thanks RJ
If you have a moment later, perhaps later on you could expand a little re: Position Size and Stops & Tgts.
I might have been a bit simple here quoting 10 point Stops / 10 – 20 – 30 Tgts.
Hi Hugh,
I think I explained this to Anstel before, I almost have a pre-defined risk per trade R and this value doesn’t change say £100 pounds per trade. Depending on my stop placement, my position size changes. For example, if my S/L was 20 points, my position size is £5pp and so on.
My stops are usually not greater than 20 points and sometimes its 5 points. I trade the Dax and whenever the trade is a winner, on average I get a 2:1 risk/reward and higher. The other thing which I follow is, if my stakes are high because of reduced/tight S/L, I reduce my position size by taking some profit and bringing the S/L to b/e. When its moved considerably into a profitable position, I look to add on any retrace depending on longer term trend.
I followed this technique initially to please my instant gratification monkey. This helped me in learning to hold profitable trades longer. I’m not in a hurry to close my profitable position as I have already made some 🙂
Hi RJ yes you mentioned it some time ago to me….I’d completed a trade luckily with a positive outcome but it had awful R/R…Like you say it takes practice to learn…..for me anyway,but thanks to you and tmfp and others I find myself asking myself is the juice worth the squeeze……if it’s not…like when tmfp says its in No- mans land….well then I will wait for a more favourable entry…….it’s taken me a while to get this clear in my mind though ….. best of luck.
Golden words, RJ, Golden. Hugh, the same, thumbs up!!!
Market sentiment worsens, central banks print a bit of money or whatever they do these days and markets rise. It’s a strange world in the markets.
I don’t know whether any of you ever check out the daily forecasts at FXEmpire, but the one for the DOW today was a little odd. Essentially they’ve missed out the fact that it closed lower and instead are showing the level as 16709 for yesterday – and being all bullish about it. Am I missing something?
http://www.fxempire.com/technical/technical-analysis-reports/dow-jones-30-forecast-march-1-2016-technical-analysis-326097
Oh dear that ISM number is no going to help my cause…
but Oil don’t like it..
Sorry I’ll stop the self-running-commentary now..
Now that I’m short again, the DOW has decided to stop following oil.
You got a stop on Si?
Enough for today, had a decent morning again but then rest of the day has been really boring.
Good evening all 🙂
RJ looks like you were on the DOW hitting 16800 today, well done and I guess I best prepare myself for the DAX to hit 10k. What is your very accurate Chrystal ball say after that, do you envisage a pullback at all or don’t you look beyond a certain point?
Hi Dutch,
On the Dax, 845 is next target. I wouldn’t be surprised to see 9945 before any pullback depends on asia. If it did retrace it might to the 670 area before further upside.
The problem is it might go beyond 10K and never return in 9K for months but that is way off. I do expect a lot of volatility along the way its not like 2013 where it just kept going one way.
There is not a lot of resistance on the Dow above 800 till 948
Thanks for sharing your thoughts RJ, I agree I’m now stuck in a trade I might need to keep for a while. Remains to be seen if they can lift the DAX beyond 760 level but heck we went up over 400 points in a straight line since about 6am this morning..I just need a pull back of about a 100 points and then I’ll be ok.
Much will depend on oil I think. If this now catches up and goes above $37.5 as I wrote about few days ago, then we could be in fr a serious bull run, especially for the DOW. But flip side, if it fades again I can’t see a serious bull run happening with everything else macro wise pointing in the other direction. I know you trade purely on pa and so do I, I just like to determine overall course on daily, short and long term and use that as guidance too.
Long at 6155. Target 6200. Stop 6136.
half off at 6170
Dave has a new friend, let a little more go at ’70. Average now at……ooooh, I’m not sure I want to think about it (!)… 6118. OK, yep, guilty, I’ve also got a bit too much VIX a bit too high.
On a serious note, good cut by tmfp earlier, hope in his absence he’s made it all back.
Welcome to the “sell more on the way up to get a better average on your short club”. Bad trading we know but I guess there is also something for sticking to your views and break a rule along the way. GL with extended Dave (not naming mine just yet!)
Due a drop to 6000 this week IMO
It’s rallied from 5500 with no real news!!
To be fair it got smacked to 5500 on not too much rich, and that is coming from a bear! It is however quite amazing that flicking through trade history I have for instance bought it at 6040 and sold it 130 points higher in just over 24 hours on the back of a 500 point rise, still doing my knackers though! Let’s hope we see 6000 soon (5500 would be nice!)
http://news.forexlive.com/!/draghi-says-review-in-march-will-be-against-background-of-increased-downside-risks-20160301
What else can the ECB do? No more Eurobonds to buy and all the banks will go to pot with negative rates and bankers don’t like that one bit. There surely must come a time when it is game over for the printing money method and it requires (painful) structural reform.
Probably encourage more bombing of the 3rd world.
Ouch shorter must be feeling this… Considering this rise is on the back of nothing but speculation of more stimulus, just show you that big market investor are full of shit.
WSF, with £1300 starting account the stake should be no more that £1-2, this way you will learn to keep your account longer. Because what is more important in trading is not to win but preserve your account. I wonder, how long have you been trading?
Sorry Jack are you sure you mean me ? that isnt my account balance.I said a low stake was appropriate for the opening trade in accumulating a position and I said a low stake was appropriate to a volatile period,ie lower than normal.I didnt suggest a number to anyone,nobody told me their acct balance,so i dont know what you are on about actually.Perhaps you could give me a hint.
Re experience it hasnt changed I was at a Forex place in the early 90’s.I dont do anything else for a living at the moment.
WSF, it’s nice to know when you started trading anyway, thanks.
OMG, sorry, WSF, I got confused here and wrote you instead of FGS. I don’t know how that happened.
FGS wrote: February 29, 2016 at 9:15 am
“I’ve got a month-long plan for March to recover my previous loss…. and start again with my original £1300.”
Again, my apologies, WSF.
However my advise to FGS still stands.
🙂 It’s been a long day thats for sure.That retreat around last Tuesdays high on the Dow and then no good indicator, for me anyway,was a bit frustrating,still not through it now.I’m looking at ASX 60 min and waiting for a clearer picture there,want to go short really.
I was thinking Dax 60 min and below from about 7 am to now is above all the EMA’s I have so maybe I misunderstood but staying with the trend or selling at wicks and buying when it retraced to the EMA’s and came up off them should have been a good day for you unless you missed the session.Hope you arent here to catch up,ASX can move in a clunky kind of way and take a while to get used to,tempting to raise stakes because it is cheap and sometimes doesnt move much but it can be dangerous with individual Co’s doing stuff 00.30 quartely GDP.
0.6 ,0.1 over expectations
http://www.abs.gov.au/ausstats/abs%40.nsf/mf/5206.0
If nothing happens in the next 10 mins or so night off time for me good luck anyway.
Hello Jack 2
Yes, that’s me with the £1300 starting balance. Thank you for your post. I’ve only been trading with my new IG account since last Thursday, so that will probably explain why I’ve been making mistakes.
I’ve made a few more mistakes since I last posted too, so all advice is being noted. Thankfully I haven’t lost everything I made on Monday and Tuesday (I’m still £189 ahead), but embarrassingly my overall losses have been far too large relative to my wins. Out of fifteen trades I have won twelve and lost three, but to be honest some of those wins were heading towards being losses, but I got lucky with them when they ticked over into a positive amount when I was moving to close them as failed trades.
Thanks for reply.