
Support 6032 6030 6012 6003 5932 5909
Resistance 6075 6097 6115 6181
Good morning.
Market Summary for Friday 26th February 2016
The main drivers for the recent rally appear to be the Shanghai meeting of the Group of 20 and China’s central bank chief saying Beijing still had the room and tools to support the world’s second-largest economy. This helped push up commodity prices as China’s demand is key to this sector. Stronger crude prices helped the oil sector to rise along with commodities.
The market managed to spike above 6100 and then close slightly below probably in an attempt to take out some tight short stops!
The market has had a strong move up over the last few days with “buy on the rumour” perhaps behind the move, so any announcement of stimulus may already be in the price.
US & Asia Overnight from Bloomberg
- Shanghai Composite sinks toward 15-month low as yuan weakens
- Crude oil trades near $33 as U.S. drillers shut down rigs
Asian stocks fell, the yen strengthened and copper declined after Group of 20 finance chiefs made only vague commitments to spur growth at a Shanghai meeting.
The Shanghai Composite Index sank toward its lowest since November 2014 as benchmark share gauges declined in Hong Kong and Japan. U.S. and U.K. equity futures retreated. The yen added to its biggest monthly gain since 2008, while China’s yuan declined for a seventh day. New Zealand’s dollar was set for the biggest two-day loss in almost four months as weak data boosted the case for an interest-rate cut. Crude traded near $33 a barrel as U.S. drillers cut the number of active rigs to a six-year low.
Steep losses on global stock markets and volatility in currencies this year had fueled calls for G-20 members to do more to stoke demand and bolster stability. While finance ministers from the world’s biggest economies didn’t come up with coordinated stimulus, they did agree to use monetary, fiscal and structural tools to support growth. They also reiterated pledges to refrain from competitive devaluations, with Eurogroup chief Jeroen Dijsselbloem noting that there was some concern surrounding Japanese policies.
The G-20 was “underwhelming,” said Ray Attrill, National Australia Bank Ltd’s global co-head of foreign-exchange strategy in Sydney. The was an “admission of downside growth risks but no tangible commitments to fiscal policy action in particular to bolster growth in the short term,” he said.
While central banks proved critical in avoiding a global depression last decade, there is now no consensus among officials from the world’s top economies for an increase in stimulus. The International Monetary Fund last month trimmed its global growth projections and said 2016 would be a “year of great challenges.”
Stocks
The MSCI Asia Pacific Index fell 0.4 percent as of 3:05 p.m. Tokyo time. Japan’s Topix index lost 1 percent, after gaining as much as 1.7 percent. Nissan Motor Co. jumped as much as 12 percent, the biggest intra-day gain since 2009, on plans for a record share buyback. The Shanghai Composite slumped 3.9 percent and Hong Kong’s Hang Seng Index declined 1.3 percent.
“There is little coming out of the G-20 to suggest major improvements in the policy mix of the most systemically important countries,” Mohamed El-Erian, chief economic adviser at Allianz SE, wrote in a Bloomberg View column published Monday. “With little hope for major policy changes, global economic growth will continue to struggle, the trifecta of national inequality (of income, wealth and opportunity) will worsen, and financial volatility will increase.”
Standard & Poor’s 500 Index futures slid 0.5 percent and contracts on the U.K.’s FTSE 100 Index lost 0.9 percent.
Currencies
The yen strengthened for the first time in four days, rising 1 percent to 112.92 per dollar. It’s risen 7.3 percent in February, more than double the gain of any other major currency.
Eurogroup chief Jeroen Dijsselbloem said in Shanghai on Saturday that “there was some concern that we would get into a situation of competitive devaluations” with regards to Japan. Japanese Prime Minister Shinzo Abe told parliament Monday he is not trying to influence foreign-exchange rates, and that an excessively strong yen has been corrected under his economic reform program, dubbed Abenomics. The currency was trading around 85 per dollar when Abe took office in December 2012.
China’s yuan declined 0.1 percent, retreating for a seventh day as China’s central bank lowered the currency’s reference rate after upbeat U.S. economic data gave a lift to the dollar. The Bloomberg Dollar Spot Index fell 0.2 percent, following a 0.7 percent gain on Friday that marked its best performance of the year.
The kiwi weakened 0.6 percent, extending Friday’s 1.4 percent slump. A gauge of business confidence fell and home-building approvals declined, reports showed Monday. ANZ Bank New Zealand Ltd. said Monday it now predicts the Reserve Bank of New Zealand will reduce its benchmark interest rate twice this year, having previously forecast no change.
Commodities
Crude oil declined 0.1 percent to $32.75 a barrel, set for a fourth monthly decline. U.S. drillers cut the number of active rigs targeting crude to 400, the lowest level since December 2009, according to Baker Hughes Inc.
Copper prices fell 1.2 percent in London, nickel lost 0.7 percent and zinc dropped 0.6 percent. A London Metal Exchange gauge that tracks industrial metals was headed for a 3.4 percent gain in February, after sliding in all but one of the previous nine months.
Bonds
India’s bonds extended gains as Finance Minister Jaitley cited fiscal discipline as one of the nine pillars of his budget for the coming financial year. The 10-year yield dropped five basis points to 7.73 percent.
The rate on similar-maturity U.S. Treasuries retreated two basis points to 1.74 percent, extending this month’s decline to 18 basis points. [Bloomberg]
FTSE 100 Outlook and Prediction
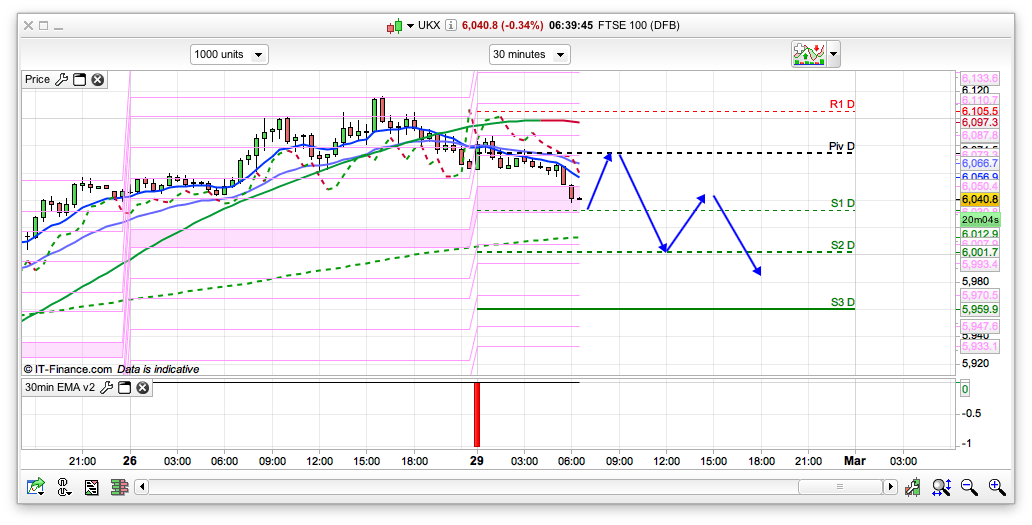
Well it looks like that built on sand and G20 stimulus hope rally has come to an end as we have dropped off from Friday’s high at 6115 since. For today there is initial support on the 2 hour chart at 6030 but its a bit weak so it will be interesting to see if it bounces there and how far. With the daily pivot at 6075 I think we will see any early bounce resisted there as it feels like the bears are sharpening their claws and are about to get back in the game. Will 6115 be the ultimate high for the bounce from 5500? Possibly… there are a couple of indicators twitching that are saying that it might be. The said, the daily chart has support at 5930 currently, so the bears will need to break that level and then 5909. To start with today the 10min and 30min charts are both bearish, with the 30min confirming a sell at 6080 in the middle of the night. I think that we might well get a rise to the pivot though today so will get a second bite of that cherry. Above that there is resistance at 6097, again I think its worth a short off this level, as I think we will test 6000 pretty soon, probably today or tomorrow. Now the G20 is out of the way Brexit will probably take over as the next cause of uncertainty. Also, falls in markets and the pound is likely to be used as a case for staying “in” so both will probably be driven lower in the run up to the referendum to convince the masses to vote to stay in the EU. Don’t vote us out, look at the carnage that will ensue scream the media!
Morning all,English speaking world got Mervyn King and his well known expertise at spotting a problem over the weekend
http://www.reuters.com/article/us-britain-boe-king-idUSKCN0W00VO
but the Germans were reading about accelerated Bond purchases apparently
http://www.marketwatch.com/story/inflation-may-force-ecb-to-take-action-2016-02-28
Morning WSF, the frog’s a bit off message then, Schauble won’t be returning his calls I reckon.
Hey, when all this is history, I think those monthly candle hammers will become known as the “QE tails”.
🙂
I think the best label I’ve ever seen on a chart is Gold,when Gordon announced he was going to sell BOE stock into a falling mkt and gave the dates so everyone was clear when the extra supply would arrive.The trough he sold at is called The Brown Bottom.
Lol, yes.
The best recently is from the nutters at Zerohedge after Jamie boy spent $26m pocket money buying JPM stock on Feb 11th and the market miraculously turned up straight away.
Then JPM issued a (relative) profit warning and ZH came up with the immortal headline
“Dimon’s Bottom In Danger Of Penetration”
🙂
Morning everyone.
I can’t see any logical reason to have negative sentiment towards the market this week (after my mistake on Friday), so I am starting this week as entirely neutral.
I’ve got a month-long plan for March to recover my previous loss, pay back my unintentional emergency fund transfer back into my savings (extra money I transferred to shore-up my ill-conceived short), and start again with my original £1300. If I can average 7.5 points profit per trading day at £10 per point, then I’ll be back to my original starting point by the end of the month.
Good luck everyone. I hope you all have a good day’s trading.
Good luck to you too mate, the only problem with specific profit goals is the market doesn’t care, and they put more pressure on you.
Just do the trades based on your system signals and hopefully the balance will take care of itself.
Thanks! I’ve been doing some more reading over the weekend and now have some figures to work with. I’ve got the daily, weekly and monthly pivot points, and support/resistance lines, using John Person’s calculator on his website (http://www.nationalfutures.com/pivotcalculator.htm). I’m reading his book ‘Candlestick and Pivot Point Trading Triggers’, which seems relevant to a lot of the discussion I’ve been reading in here. I know I can get the pivot point data here, but I wanted to go through the process of using that calculator as part of my daily preparation as I think it helps with the understanding.
Before market hours, I was pretty sure I could see a short trade entry trigger (occurring Friday evening) on my 15-minute chart, and also the 5-minute. It was a doji candle, followed by lower closing low, and also occurring below both moving averages. I was happy with that as the prices were around the figure I have for today’s pivot point figure (using Friday’s numbers) of 6074.73. All that went out of the window when things gapped downwards first thing this morning, so I watched the new lower price action for a while, which seemed to be respecting my (re-drawn) downtrend resistance line around 6053.
After a couple of back and forth movements I decided I could see where to jump in and out (in at around 6060 – 6050-ish each time) with some shorts (£10 per point), and was successful with all four trades:
Short 6050.3 – 6040.8; 9.5 points; £95.00 profit.
Short 6051.3 – 6046.8; 4.5 points; £45.00 profit.
Short 6058.8 – 6052.5; 6.3 points; £65.00 profit.
Short 6060.9 – 6050.5; 10.4 points; £104.00 profit.
I’ve lost the feel for the price movement at the moment, so I’m stopping for now before I get over-confident and make any mistakes.
Excellent, basically sell the bounces, good plan.
You may like to keep an eye on the 1 min 10 rsi, which has been incapable of breaking 60 for an hour now, hence the orderly decline.
As we appear to be attempting consolidation off 34, a break of 60rsi would tell me that’s there’s a bit of life in it still and would look for a try at a higher high i.e. 52.
Thanks, I’ll have a look at that. I’ve got 6034.09 as my S1 figure, so that makes sense as well.
fwiw now the onus for a continued rally is 40rsi holding.
That was a bit of luck, as it happened. I went short at 6066.3, just after that sudden rise at 10.00am, but had to go out, so closed it at 6060.3 for a 6-point gain, with the expectation that it would head back down towards the S1 level. I’ve just got back and it’s up to 6082. Good job I didn’t leave it open.
Short 6077.3; closed 6075.3; 2-point gain. Strangely this one also captured whole points, with no odd fractions.
Morning guys, basically what Nick says ++.
To be honest, the G20 couldn’t have maintained much cred by continuing to publically put their faith in an ongoing QE/neg rates approach and they are right, some form of structural change is needed for the onwards and upwards for ever system to have a chance.
Being the devious bastards that they are though, abandoning formal QE doesn’t mean the Plunge Protection Squads get their P45’s, what better to disavow interference and bung a few Squillion to JPM instead, then point to the ensuing recovery and say “Look, no hands.”?
Bit of a battle for 6060 going on quietly/nervously this morning, good scalping weather.
Being the 29th means two things: monthly candle and, talking of formal arrangements, hiding from my SigOther. 🙂
Morning All,
Not a very good range on FTSE today but I have just nicked some small points on 1min chart. As Nick mentioned, I am looking to short again at 6060 level or at daily pivot 6075 – Dax is very weak today so hopefully we can see 5000s again very soon.
So pretty much same for today, looking to short any bounces on RSI 1 min.
GL 🙂
Lovely it was: little scalp 9372-9336 full stake, lovely 36 points. Briefly looked at Nick’s arrows (thanks) and my set up was short.
Excellent Jack, long may it continue 🙂
Thanks, hope so 🙂 I wanted to hold initially to 9320 but MACD didn’t stuck up and looked suspicious. I see divergence now. Good I quited when I did, new retrace started.
Well done Jack – I saw that drop coming at Dax but shorted FTSE instead at 6055 for +10, was expecting FTSE to drop to 6010-6020 area but we have a strong support at 6034 – let’s see how long it’s gonna last 🙂
Hope so.
IG says Dow could lose 6000 points over the next ‘year or two.’
http://www.ig.com/uk/market-insight-videos?bctid=4775220784001&bclid=3671160850001&icmp=charts
We can probably buy Lloyds for pennies then lol
Colin Cieszynski at CMC is sticking to his base building patterns theme,ranges pushing at the top and raising the Support.Australia fitted that last night whilst I was on it,but they had Co news rather than global and a minus no for mthly inflation.I dont mean I think he is influenced by Aus when he looks at the rest of the planet,plenty of places look better than Australia and I dont really like it as a long,but he has been consistent with his base is in analysis for a while.
I saw a FTSE 6100 + close to 6380 call and a Dow to 16865 call and Dax 9588 to 10k call last night all from people on a guaranteed salary too :).
and get a free RBS, sort of BOBGOF.
Oh (Dax)
Jst grabbed 15 halfs on dax
Nick’s 6074, here you go. But is it an invite to short?
Hell yeah, not that I need one 🙂
I won’t short now, better wait.
Lol, the dangers of news trading. Terrible inflation miss and we go up 30 points….
I didn’t know we expected some news. But good I didn’t attempt another short at 9.56 dax.
I think this will collapse, eventually.
Interesting that was at 16500 on the Dow out of hrs.
lol, you are incorrigible.
And what’s this bull FUD I read you spreading on yesterday’s page about the FTSE downtrend broken?
Not on my chart, solid as a rock, looking like a nice shooting star coming up today too…..
🙂
🙂 🙂 I almost mentioned RSI 10 on the day chart too,but I thought that was a step too far.
Here you go. Against EMA, don’t make me laugh, of course it collapsed. But I didn’t trade this one, tricky. I think it was a stop hunter.
Take your point about the Mthly though tmfp,cant see another 70 points to make that a Hammer happening.
Gosh, FTSE didn’t move!!!
Actually, although I can’t pinpoint the exact time, that rise may have been inspired by the Chinese deciding that their banks are over capitalised and cutting reserve requirements by 0.5%. Makes sense lol.
Anyway, the upshot is the rally is sort of sticking here although not so with the DAX.
40rsi held on our 1 min, so thanks for the fish and all square now.
lol I shorted 47 for some reason on that spike and out with -12!
Shorted 65 again and took +8.
Waiting for another decent bounce but FTSE is not moving from 60s now.
My MACD shows it will be a continuation of this rise and on dax – another test 9420th. I’m reluctanct to trade with sideway formations defending some level below.
Thanks Jack,is that from the 15min chart ?
I use 10 and 1 min for the mains. Other fime trames for confirmations.
9440 would be considered for shorting.
Thanks,I mostly have 1,5 and 15 open,thought you might have been influenced by where it looked like the 50 and 200 sma would converge on the 15 min at 11.20,price is at 200 now,50 is at 24.
Short 76 10 either way
Yeah, that 25 point grind up tempted me a couple of times, both b/e though, just one half +5.
I’d like to think it could drift off the same as it’s drifted up, but the battle of 60 appears to be going the bull’s way atm.
Waiting for the DOW for the next bit of momentum.
I know that spike was a bit too much for a movement- I am all square now as I can’t focus today for some reason, took pennies on that 76 short. On the other side, we have a crappy range on FTSE while DAX is having a proper fun day 🙂
However, I rather stay with FTSE as DAX can be pain in the arse sometimes!
Oil is up though and maybe FTSE is looking ahead at 6100 again. I guess I will wait for a bounce again.
and here we are 6100 coincided with v overbought short term but a good 4 hour long trend support around 80 now.
A bit of a push from the DOW and another go at 6115 1st Feb cash high is on the cards.
Ive shorted 6097, 6080 might be the limit of it looking at the lacklustre bear action so far
Hello 6100 again 🙂
Oil is still behind this slow rise today or maybe I should say Saudi’s
http://www.cnbc.com/2016/02/28/oil-prices-rise-signs-mount-that-market-is-bottoming-out.html
Let’s see how DOW plays out in a bit but we are not far away from a big heavy resistance at 6131 area and if we break this today then I am still expecting 6300 is on the cards and then followed by a lovely drop to 4000s 🙂
OMG it feels like Sunday IG trading
That trendline is now at mkt, 87ish and I don’t know what to do really, incubating a 98 short for half an hour…
Suppose I’d better take it out at 85, a little oversold and the DOW breathing bull down our necks…
When CNBC is bullish, I still have hope
Even DOW is not moving much.
Did two trades -5 and then +5 lol.
I think I will sit tight for rest of the day!
This isnt good,although it gives him a reason to pump RBS & LLOY lol :
http://www.telegraph.co.uk/business/2016/02/28/budget-woes-mount-as-osborne-struggles-to-control-debt-mountain/
I read over the weekend the US are counting Student debt as an asset.
Well, I am looking to buy Lloyds again at 55-60 area but can definitely see this to be over 80-90 in next two years as you mentioned last week.
With regards to RBS, I rather not touch this for a while LOL even their online banking is sh*t!
Yes,their pet,Nat West’s FAQ and topic search doesnt work and they changed Intl Transfer and chq Clearance cost and timescales without mentioning it in the compulsory Helpful Tips Email.I’m eligible to pay money every month to get an acct where the interest will cover the cost if I had a House worth of cash on deposit though,thats a top tip.
Hi all,
Not much time for trading, did a small short earlier on the DAX but that is it, too busy with real life stuff 🙂
Looked at the 2 and 4 hr charts on the DAX and they clearly pointing further downwards, yet somehow I got a sneaky feeling this is going up later today / this week. Weird
Why did God create Traders ? To make Weather Forecasters look good.
LOL nice one
I thought that was economists 🙂
God made us traders as a punishment for our previous lives.
🙂
These downside gaps are weird on the DOW, shows how light turnover is?
Taking a bored flyer at 72
just took +8 on 65 long, was hoping for more but can’t trust this weird range today.
another long at 69
took +5
out for pennies and a walk
LOL
Will be back for MHH now, can’t be bothered with this today!
tmfp – do you have a plan for MHH today?
So, nearly the end of a forgettable session, DOW rallying after touching 16600 and dragging us up to the 80’s again.
Can’t see much pattern established for the MHH at all.
If the DOW succeeds in this apparent second attempt at 16660 then we could get pulled towards 6100, but 20 pts in half an hour would be more than we’ve managed since the slow fall to 65.
Short at 81 stop at 88
short 84 and out for -2
are you planning to short at 6100?
Not particularly, this close to the close
30 points drop in 6 minutes, we should have shorted 6100.
Hopefully, we will have some movement tomorrow
and finally out for -10
LOL – I can imagine how you are feeling today tmfp!
I was at +15 or something this morning and I am still at +15 for the day.
Anyways profit is profit 🙂
I rather go to Gym now and cook some nice dinner. Good Evening all
Evening.
Dow is putting an effort in,4hr looks pretty healthy too.
https://petition.parliament.uk/petitions/112392
Maybe that’s the reason I worked for free today(sort of)!!!
🙂 There is one somewhere about correct reporting of trades,intraday buys vs Sells on Shares instead of estimates by transaction price etc keep seeing it on Bulletin boards.
Here is a good one https://petition.parliament.uk/petitions/123238 didnt know they didnt.
Reuters briefly had a headline just now of “S&P 500 falls below closely watched threshold” and then edited it to “Wall St. falls as healthcare, energy weigh”.
The article is still on Yahoo :
http://news.yahoo.com/futures-lower-concerns-over-rate-hike-slow-growth-123343585–finance.html
They are talking about the 50sma.Where it bounced from last Wed probably matters to more people at the moment imo, about 1890.They say themselves it only went above the 50sma for the first time this yr on Thurs.The Dow didnt get away from 16500 by more than 16 though so who knows.
Well WSF, I finally found how you make money on Australia 200 when all of us are sleeping 🙂
Just went long at 4860 and out at 4900 +40 points in 5 minutes
I am switching to ASX from FTSE now lol
AXS is very low volume index though!
🙂 You should have seen it on Sunday night lol.