
Good morning. Well its certainly being a bit tricky this week and I wasn’t expecting to see 6550 yesterday. That was the bottom of the 20 day Bianca channel and held pretty well in the end though the initialling was half closed at 70 and rest at 62. the earlier long that I SMS’d at 6602 managed a few but then got stopped at break-even. So a few points gained but not as many from that rise to 6600 later int he day as i would have hoped – was just being a bit too cautious I guess, which is probably prudent on day when its dropping and going counter trend, even if it was bull Tuesday!
Decent manufacturing news yesterday had little effect on halting the initial fall, whilst news that the UK will have the strongest economic growth (2.9% GDP forecasted) of the G7 failed to get anyone excited (wonder why….. probably as its just a number plucked from thin air and doesn’t actually mean anything and is bound to be revised and adjusted over time as it always is!). Unfortunately its once again growth built on credit and the underlying issues are still there so the chickens will come home to roost yet again, probably making 2007/2008 look like a minor hiccup. This article sums it up quite well. The reality correction of the overpriced stocks mostly on the Nasdaq continues and about time too.
Asia Overnight from Bloomberg
Asian stocks outside Japan rose, with a gauge of regional shares heading for the highest close in five months, as consumer companies advanced. Japanese equities fell after the yen rose the most since August.
The MSCI Asia Pacific excluding Japan Index gained 0.9 percent to 481.32 as of 12:04 p.m. in Hong Kong. About two shares climbed for each that fell. The Hang Seng China Enterprises Index gained 0.4 percent, with the gauge of mainland shares listed in Hong Kong on course for the highest closing level since January. The measure rebounded 12 percent through yesterday since entering a bear market on March 20.
“Below the surface, the global recovery is actually stronger than most investors perceive it to be,” Thomas Thygesen, head of cross-asset strategy at Skandinaviska Enskilda Banken AB, which has $213 billion in assets under management, told Bloomberg TV in Hong Kong. “There’s a clear sign that China is moving away from the credit tightening that was a big source of the growth uncertainty at the beginning of the year. That’s one of the keys to keeping the global economy on track this year.”
Regional Gauges
Hong Kong’s Hang Seng Index rose 1 percent and Taiwan’s Taiex index added 0.4 percent. South Korea’s Kospi was little changed and New Zealand’s NZX 50 Index added 0.7 percent. Singapore’s Straits Times Index rose 0.1 percent and Australia’s S&P/ASX 200 Index (AS51) advanced 1.2 percent. India’s S&P BSE Sensex Index climbed 0.4 percent, snapping a three-day drop.
The Shanghai Composite rose 0.1 percent. Trainmakers CSR Corp. and China CNR Corp. advanced after the People’s Daily said the government boosted its railway investment target for this year.
Japan’s Topix index slid 2.1 percent as the yen traded at 101.98 per dollar. The currency strengthened 1.3 percent yesterday to touch a three-week high.
U.S. Recovery
The MSCI Asia Pacific Index, which includes Japan, fell 0.2 percent to 138.28. It has risen the past two weeks, climbing last week to its highest level in more than two months, as U.S. data pointed to a recovery after severe winter weather curbed growth and China outlined stimulus to ward off a slowdown. The measure yesterday traded at 12.5 times estimated profit compared with 15.8 on the Standard & Poor’s 500 Index, Bloomberg-compiled data show.
China is able to loosen monetary policy “moderately in some areas for a while,” such as by cutting the reserve requirement ratio, Zhang Monan, a researcher at the China Center for International Economic Exchanges, wrote in an article in the China Securities Journal.
Stronger U.S. growth this year and next will help the world economy withstand weaker recoveries in emerging markets including Brazil and Russia, the International Monetary Fund said in a report yesterday. The IMF predicted global growth of 3.6 percent this year, compared with a January estimate of 3.7 percent. Next year, the expansion will accelerate to 3.9 percent, unchanged from the prior forecast.
S&P 500 futures were little changed today. U.S. stocks rose yesterday, with the Nasdaq 100 Index rebounding from its worst three-day drop since 2011, as technology shares from Google Inc. to Facebook Inc. rallied. Alcoa Inc. added 1.9 percent after the close of regular trading as it reported earnings that topped analyst forecasts.
FTSE Outlook
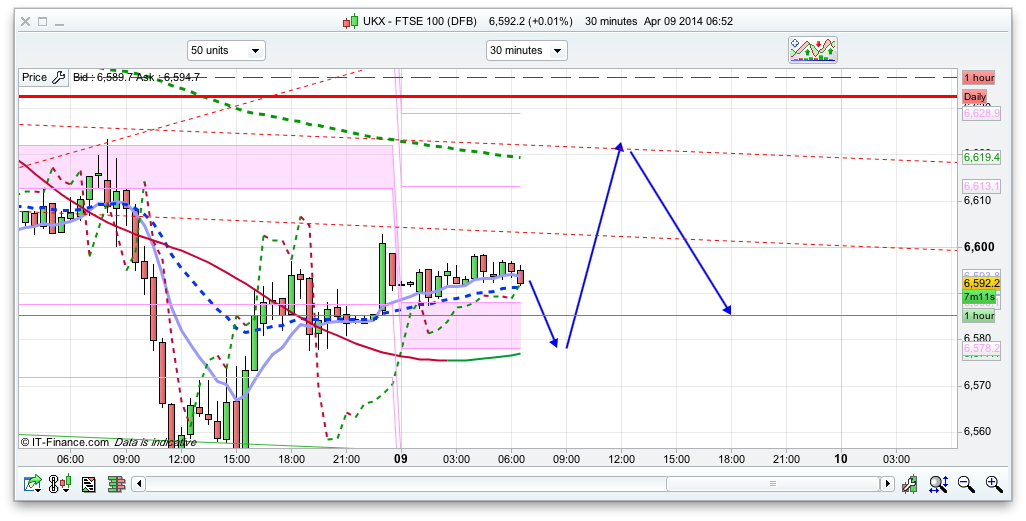
The bottom of the 20 day Bianca channel held well yesterday with the test (twice!) of the 6550 area. Today sees both Bianca channels in the 6575/6585 area and with todays pivot from live charts at 6588 we might find support at this area. However, its been pretty weak since the initial climb to the 6600 area yesterday evening not really doing much since. Some are saying that the Russia situation is what is causing this rather weird behaviour on the indices and that might well be the case. That and probably quite a few traders have taken Easter off for the last ski trip of the season!
Anyway, for today if 6595 can be broken and held then the bulls will be looking to reach 6628 and 6650. If that 6580 area breaks then 6520 and even 6450 (bottom of the Bianca 50 day) are downside supports.
Nick
Could I ask you a few questions on your prediction.
1. Your chart predictions are showing – 1st Move to 6580
followed by higher move to 6620 – after which there is a move
back to 6580
2. You also say – If 6595 is broken – then we reach 6628 & 6650
There appears to be a certain amount of contradiction in both of these
statements.
Could you give clarity on how I should interpret this?
The Arrows or the Resistances & Support as outlined by you.
Thanks
Rob – I think what Nick was trying to impart was that it was either one or the other.
1. Range bound 6580 – 6620
or
2. If we break 6595 ( & do not test 6580) – then we reach 6628 & 6650.
Thank you for your interpretation.
1 So basically all that Nick – does is to give Support & Resistance
areas based on various pivots – Day / Bianca etc.
2. His interpretation of how these areas may play out
3 So really – as a trader – we just take a NOTE of Nick as a trader’s
personal interpretations of these areas.
4. So Essentially – We as traders should have our own views of the
market.
Exactly.
He doesn’t predict a move, which is a pity. But very often his arrows do come to life. Be careful with sudden drops as Nick CANNOT PREDICT THOSE.
To be honest – to know where the next Support and Resistance is, based on some Bianca etc. is very important as I don’t have time to do that.And if you see it bounces you trade the bounce, and if you see it breaks you trade the break.
Personally you either trade at 8-9 am or 13.30-15.00 onw.
he thinks it MIGHT reach 6650 but in his view most likely not and is looking to trade around 6620 short..
somewhat similar to mine but the freaking market shot up, only good thing is that its early market hours so thats an advantage to a shorter like me…if positions are built correctly u should be ok (i hope)
LoL – Not only are we trying to second guess the FTSE but now we’re also trying to figure out what Nick is saying !
looooool,
well graph clearly shows hes expecting a drop from 6620ish
back to pivot 🙂
Morning all, royal mess up for me this morning went long 6612 after pullback to 6602 then instead of turning my phone off I kept looking and closed out at 7622 when it double topped. Grrrrr
Short 6541 Tgt 6620
Typoo ** 6641 Tgt 6620
Rob
How I read it if we had dipped back to pivot then we would have had to break 6595 on the way back up if this broke then 6628/6650 possible.
Nicks chart is bang on 6602 being big resistance from previous days
Marco
You were asking Nick about a Course or seminar or something in May.
What is this about ? & how much is it pls.?
Thanks
Rob
BEWARE posible dow rise 16424 prob ftse pullback hasent went to btm of todays candle yet i think 6585 short from6629
Didn’t understand a word of that ! Lol
looking at charts today i see a possible rise to 16424 if this is the case with ftse being 6655 top to straighten things out ftse would need to come back before dow open to6585 to then rise along with dow ………make any sence LOL
I placed my order last night short 6629 dow seemed to stall from back movement last night from 8 o clock
😉 ?
6635 to hold?
Small short at 6642. Expecting it to rise this afternoon though with Dow
Rob thanks for reminding me I need to confirm that with Nick. It’s in May 22 near Southampton best email nick to get full details I need to do as well.
Just looking at the 5 day trend lines from 4th April
FTSE Trend Line 6642
CAC Trend Line 4436 (CAC now 4445)
DAX Trend Line 9554 (DAX now 9526)
6623 didn’t offer up much resistance, and bulls were straight out the blocks so didn’t get my long on from 6588 either. Argggggg, tricky this week. 6650 is the next resistance area I have now…
This is THE worst start to the year for me… literally impossible to trade..for me atleast
Dax not breaking the 200 ema either so far…. http://td.md.it-finance.com/ProRealTime_V10/display_chartimage.phtml?name=ywrehapsxpehszvubmiplgost&type=png
6635 held so expecting 6650+ now.
If anyone is interested gbp/usd looks a good short. That son of a gun had a 150 point spike yesterday.
I’m with you Hashmash market is very frustrating atm
nearly every trade has gone against me.
just checked,
all the trades that went against me were moderate to max risk.
all the successful trades were minimum risk – below moderate.
~.~
lol realized if i played the 6637-6645 range in the last few hours i wudve made my loss back and profit on top haha, stupid ftse
Hindsight hurts the most on losing days… Ftse holding up well atm, rise on DOW open then drop, been the scenario last couple of days
ye unfortunately its all hindsight….i think the price now is good enough for me to take my loss :S….give it till 1-1.30 and ill see
Must admit my trend indicators keeps switching – now just so slightly bullish but I have a small short at 6640 as any drop back will take it back towards bearish. Not going to trade too much until the trend is firm and confirmed by more than one day’s movements!
lol we made the same indicators or what?
My indicator showing reversal from bear to bull…
AND i have max risk short on..looking for an exit point lol
Thankfully my small short current BE – i know that as soon as I close it the market will start going down and vice versa!
exactly…thats where im stuck now, soon as i do something it goes in opposite way.
It’s emotions, hashmash.
I’m looking at FTSE and it retraced 61.8% so theoretically now is the time to drop. But I don’t see it’s brewing at the moment. It seems that they are ignoring all trading rules like Fibs for example. No direction, it’s like sideways now – up and down. up and down.
Indicators really only work well in trending markets this is more a range bound market.
yeah too right – which is what I have backed off any major positions. It was trending (up) till Friday but i find you need 24-48 hours of it not trending to confirm its not trending (if that makes sense)
loool DavR0s thats exactly my mentality, i give it usually 48 hours to confirm my indicator trend.
And yes Luke – range bound market = death of trend followers
U guys mustve heard me mention that US and EU were out of line (correlation)..
i can now say they back in line…
Looking at 1 hr. charts, wouldn’t you say though Hashmash that the Dow actually trails the FTSE in coming out of this dip, the trough being yesterday. Perhaps things will even up later today, although a US advance should further boost the FTSE. 🙂
Ftse been moving within 10 points whilst DOW moving up. Expecting a test of 6650 before a drop?
I don’t expect any drop today though, it feels like job for tomorrow.
16316 showing resistance on dow hope pullback from there
I’m not considering any shorts now, personally think the US will take another leg up, no sign of weakness whatsoever.
im out the short..
Max risk in lots, max number of points = butt rape loss
My default position at the moment is that the Dow is beginning to rebound after its plunge starting last Friday 4 April. In that case, the short-term ϵ-channel shown should continue to contain the variable. There might be some faltering, but as a next stage I’d look for the Dow to make its way to the central track of that channel; ≈ 16400, which should bolster the FTSE’s positive trajectory!
http://i1348.photobucket.com/albums/p736/jmca01/WallStreetDFB_zps66f93519.png
Tend to agree with you.
but S&P Overstretched on long side – so a meaningful
retracement due – probably after a 4 pip move higher
the signs are on the chart as on Dow – 40 pip move higher
before move down
LOOOL soon as i close market drops 10 points
Always the way – just closed out BE as the US seems to be picking up steam having dropped at the open. Will sit out today now as there is no meaningful trend that holds for more the 1 day at the moment!
Got a Long signal on my RSI/ 5 min 6630 bit I’m slightly wary of these at the moment !
Some sort of short going on, but it doesn’t seem to be a strong one. Retrace on Dow, another leg down and I think that will be it, no 16250 breaking today. imho
it’s only 23% retrace there at the moment, need’s another push up.
I am switching off and will come in the evening to check how it went. No trades from me today.
Closed short at 6630
All eyes on this area again as we run up to 6650…Stops at 55/56
If we are going to retrace – here would be the ideal opportunity..
Looks like the push higher is over.
Rob – I’d interpret the turn at 6647 as weak – we need to close below 6637 and then 6630 to (50% moves) to validate them as signals.
…otherwise – if it bounces off 6637 and closes above 6645 we could be in an uptrend.
Just using 50% to gauge strength / weakness
OK – but my indicators are indicating a bias
towards a short trade.
TRADING HAS BECOME SO FRUSTRATING LATELY!!! NO DIRECTION
ive lost my emotions for it now…
I have left my screen for about 2 hours and it is where i left it – going nowhere fast! In the meantime enjoyed the spring weather outside.
Totally…but worried about being caught napping !
Stops are in …
Well i do admit to having alerts sent to my phone incase anything starts to move but no danger of that !
Same here. I just want to make it back to b/e and take my money out the account now lol.
Taken my short position – on Ftse – with a move down to the lows set yesterday.
This upside venture is complete as per my charts.
Stops in at 6555/60 maybe …..??
I’m useless at putting stops in but understand the value of them !
They allow you time to think.
Normally the other side of the trade can square your position.
The loss is controlled in comparison to profit/loss profile.
Yes – Sold 40 – with stop at 60 – We should see this move
over the next 24 hours – ( Hopefully ) but worth the risk.
gonna kill myself if it drops looool
God this is boring as hell !!
Just a quick review of the day.
Break above Resistance 6603.
Did do a very early small retrace at 8:10 then up ..
3 RSI Sell signals above 70 ..6608 – 6620 – 6632.
1 RSI Buy Signal at 6630.
These normally turn in a nice profit – patience.
MACD Divergence at 6655 – always hard to see in realtime…obvious now..
Series of lower highs since 6655 – support 6630 – 6625 (Sloping Trend Line)
I’m off……
S&P recovering its losses lol. Thank god the ftse wasn’t dragged up by much. Closed out for -6, atm market too random.
16400+ and holding — a bit earlier than expected — shows what the right set of Fed Minutes can do, I suppose.
LOL – and here i am now again saying..
this move has pushed my indicator to buy the fuck out of ftse…
-.-.
gonna buy at 6636-40 tomorrow if we see it
I’ve got the pivot at 6631 so on very similar strategy but I want to see that tested and bounce. I’d rather lose a few points rather than see it sail through and go down. Suspect the fomc suggesting the interest rate timescale is too overcooked could easily create a good rally now for a few days. Just need a good entry now.
Yep I am looking to buy dips again! So it’ll probably be a down day but hoping not!
hahahah yeah down day tomorrow cus us 2 buying
Lol, the damn indicators.
I have stuck to my strategy selling off when all indices was at highs and bought again on the dip, so far has worked a treat.
I am not one to tell any of you guys anything, but perhaps you should go back to basics?
Someone mentioned it the other day.
The thing is as annoying as I found Nitup’s posts I agreed with his trend.
How about you give those indicators a break and do it the old fashioned way? 🙂
Gl anyways
cant leave a strategy which is known to create losses in range bound markets but be extremely profitable in trending markets.
The issue is not with the indicator but on discipline, knowing not to trade in range markets.
Question : One may say how would u know if u are in a range market?
Answer: It will be quiet apparent from charts..plus most likely the trend indicator will piss u off.
Question : how do u know the range bound market has broke its range and its not just ur indicator coccking up like it has while the market was range bound?
Answer : Well u dont until u either get in the trend late, or miss it totally.
So, now im gonna totally sit back and wait, if market hits 6635ish tomorrow and my indicator increases in strenght then im buying otherwise i wont even follow the market (set up alerts)
That is so right – have lost about 25% of last weeks gains this week so have to keep it in perspective – would take that any time
Believe it or not that is what I am trying to do. Worked well last week but not this week as the dips have then gone further down
Havies – I’m looking at 5 min charts & expect many here are also.
I am totally aware that looking at 5 min charts ( or other small ) time frames leads to being ‘blinkered’ of the larger picture & patterns that are in play…
My trading seems to have gradually got worse over the last two weeks!
What you are pointing out has reminded me of perhaps were I was when each trade was positive.
My thinking is simple here that today was just relief rally….. Let’s see if it can hold tomorrow.
It’s a bare-knuckle ride, but we should see ≈6700 today – thanks to the Fed minutes.
Well there’s the rise but no blinken dip. I have resistance around 6682 so hoping now that it will come down a bit
Small short on ftse @ 6685 going to leave this all day & check back at 4 pm this afternoon gl all.
Doubt if we’ll get much of a dip immediately, maybe stonewall now until pm – but favour moderate rise.
US jobless claims etc @ 13:30.