
Good morning. Little bit of a strange day yesterday, we got the rise and dip, but the rise took a while to get going, fell just short of the 6682 short order (high was 6673), then dropped all the way to a low of 6585. Reality is starting to hit the tech shares in the US with their crazy valuations for companies that make no money hence the Nasdaq has taken a pasting the past few sessions. Think the penny is finally dropping! The recovery in shares prices is mostly underpinned by share buy backs as well, so plenty of reason to remain cautious. I am still bearish for this week, especially with the drop off the 6700 area on Friday, being the 10 day Bianca channel top.
We are going into earning season now in the US and that usually makes things a little bit choppy.
We have a few bits of production data out at 09:30 though not particularly market moving usually but will give a feel for recovery sustainability again, so decent figures might get the bulls going. We have the divi today, only small at 1.8, but will the usual bull Tuesday pattern repeat – dip first thing then rise?
Asia Overnight from Bloomberg
Asian stocks fell for a second day, following the biggest three-day rout in U.S. shares in more than two months, as health-care to technology companies retreated in Japan. Chinese equities rose.
The MSCI Asia Pacific Index declined 0.4 percent to 138.02 as of 12:28 p.m. in Hong Kong as eight of the 10 industry groups on the gauge retreated. Investors are selling technology and telecommunication firms across the region, paring holdings in Internet companies that have led gains in global equities during the past 12 months.
“Equity valuations have peaked and markets will trade nervously going forward,” said John Vail, Tokyo-based chief global strategist at Nikko Asset Management Co., which manages about $157 billion. There is “accelerating deterioration of China’s economy and financial system and subpar U.S. and Japanese economic growth.”
The MSCI World Index of developed-market stocks reached 15.4 times estimated earnings this month, compared with its average multiple of 13.8 over the past five years, according to data compiled by Bloomberg. The MSCI Asia Pacific Index yesterday traded at 12.6 times profit compared with 15.7 on the Standard & Poor’s 500 Index, the data show.
Regional Gauges
The Asia-Pacific stock gauge last week climbed to its highest level in more than two months as U.S. data pointed to a recovery after severe winter weather slowed growth and China outlined stimulus to ward off a slowdown.
Japan’s Topix index slid 1.6 percent today as the yen rose for a third day, trading at 102.98 per dollar. The Bank of Japan maintained its monetary-base target at between 60 trillion yen and 70 trillion yen today, concluding a two-day policy meeting.
South Korea’s Kospi index and Taiwan’s Taiex Index advanced 0.2 percent, while Singapore’s Straits Times Index added 0.3 percent. Australia’s S&P/ASX 200 Index retreated 0.2 percent with trading volume 27 percent below its 30-day average for this time of day. New Zealand’s NZX 50 Index lost 1 percent as Xero Ltd., a developer of online accounting software, slumped 12 percent.
China Reopens
Hong Kong’s Hang Seng Index added 0.9 percent and the Hang Seng China Enterprises Index rose 1.5 percent. The Shanghai Composite Index gained 1.3 percent as mainland Chinese markets reopened following a holiday.
S&P 500 futures rose 0.2 percent today. U.S. stocks fell yesterday, pushing the Nasdaq 100 Index to its biggest three-day retreat since 2011 as technology shares extended last week’s selloff and erasing the year’s gains in the S&P 500, which has lost 2.4 percent in the past three days.
Alcoa Inc., the largest U.S. aluminum producer, unofficially opens the U.S. quarterly earnings season when it releases financial results today.
FTSE Outlook
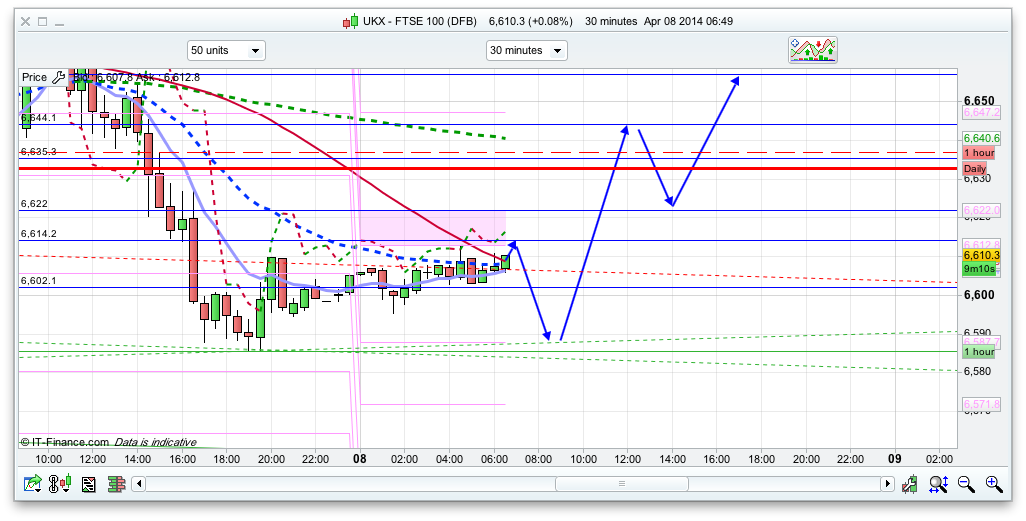
Todays pivot is 6644 so I expect that will act as resistance to any early rise, if there is one. We overshot the bottom of the 10 day Bianca channel with yesterdays bearishness, which was a little surprising, as we only tested the top on Friday. As such if 6602 holds today then the bulls are still in with a shout. The “usual” (I say that slightly tongue in cheek as its never quite that predictable) bull Tuesday pattern is dip and rise so am about 75% expecting that today. The 30 minute chart certainly looks better positioned for a bit of a bounce, looking at the EMAs which are about to cross. Upside resistance levels to watch are the pivot at 6644 and also 6657 so i think that 6650 area will be a possible shorting area. Should the bulls break 6657 then I think revisit of 6700 and possibly the top of the Bianca channels around 6720. Yesterdays drop could well have just been overdone, and considering the bearishness on the S&P/Dow the FTSE has held up pretty well. The S&P tested the bottom of the Raff yesterdays and todays 20 day channel has support at 1842. I think a climb there to 1875ish before more downside, which would carry the FTSE up with it.
If the FTSE is going to drop initially I think the low seen yesterday at 6585 will act as support, as we also have some green ProTrend lines in that area.
Thanks Nick. Shorted from 6618 closed at 6596 think its still got to bounce yet from lower but looking to go long into lunch then close.
Can anyone tell me why the high of the day is always recorded as much higher than it actually went !! Saying yesterday’s high was 6695 when we know it only went to 6673. Just means when I am working out pivot supports etc if I use that figure instead of true it can’t be right???
Should have held.
Anyone any idea where support is if 6585 were to not hold
next is 6551- bottom of the 20 day Bianca (just hit!)
Spot on!
If 6585 breaks then support ll be at 6655 bottom of 10 day bianca channel
ok thanks – looks like we will know very soon
Long 6584.8
Short at 6578
Gosh. So opposite thinking.
Marco- 6695 is the recorded high for yesterday as it was the closing price for friday.
I know the ftse never was at 6695 yesterday but it will just show a massive drop from 6695 on the chart.
Test
Sheesh this is very weak – again. Glad I am out at the moment
Wow turned phone on to see it didn’t bounce and I got stopped out at 75. Wish I had held myshort first thing now …!
Does not look like its finished I have S3 at 62
My thoughts – FTSE down 59 points . Probably happier around 6520. Guess it could easily come off another 40 points today.
If there is any upside – it seems limited at the moment…
Certainly all indicators look stretched – but think I’d put those to one side – simply trade on averages and patterns
Anymore support levels left for the day?!
That must be quite a few of the stocks and shares ISA people who invested last week done over now…..
Put mine in cash – waiting to switch later
DOW to take the drop further? Finished very weak last night, in for another good drop.
FINALLY caught 60 points down 🙂 closed short…
was minimum risk (1 lot)..so not a great deal of profit
6593-6600 should be a prime shorting opportunity!
id love to see that area again but not sure if we will though
Yes I am holding my short from 6592 now. stop at b/e. Previously when we dropped below the daily 200 EMA, we did not rise above it until a drop of 100-200 points on average.
nothing holding dow from btm 16080
Little rise before the 13.30 fall?
ye im looking for a rise..
u guys cant understand how happy i am lol
stuck to my strategy yesterday closed a long from 6626 at B/E
Shorted this morning from 6610
and guess what i manage to catch some points and NOT B/E lol
Its just my strategy stuck in a range bound market, and it performs crap in such scenarios
tried min short on dow to see how it would take it just pushed up 25 points at time of writing
DOW to touch 16300 before another leg down?
well that would end all shorting today
game 0n sure thats only 50 points
Well, got 21 points scalp, not bad for US open. Done for today.
FTSE seems unable to make any meaningful rally. Now only prepared to short peaks but will probably leave it for the day now unless we get a good entry point
Ftse trying to use any excuse to go higher… DOW will keep it down should see it come off after hours…
Infact I see it as if Dow & S&P want to take these markets higher
Really???where do you see that??
Like a triple bottom from here
Good luck with that…:-)
No Problems
With $1.674 to a £ I can see no chance for FTSE to move much higher…
shorted 6573
Hash – If it’s not too time consuming – what prompted a short at 6573 ??
strategy showing bears (please no one tell me off for saying my strategy is showing this..i know its performing shit because of range bound – but i have to stick to it)..
ALSO
I have resistance around 6580ish level and a down channel.
also in prep for tomorrows releases
What type of strategy do you use ?
trend/momentum follower,
hence why im getting my butt raped in a tight range market.
Haha – my plan has been buying the dip for a while but decided to stop at 2pm as the dips were not yielding any decent rises. SO the first time i don’t do this it rallies 1/2% !! Shall be peeved if it sales past 6585 now….
What made you stop your plans – Chartwise or Tradingwise ?
I often find that I stop because I have lost money – but have tried to
ignore it – very very difficult but !!
Bit of both – i only try and go in the direction of the dominant daily trend and that has changed this week from up to down so had been trying to buy the dips. Worked a treat last week and failed every time this week so far. Still well up but decided to reevaluate as all the rallies had been very weak yesterday and today… till now. Its not that strong though so…. my plan is to hold of several days so all about getting a good entry point and am not convinced this sell off is done now when measured over several days.
Also agree about the money thing so this was more about the rallies not being very convincing unlike last week
OK – so you are now thinking of selling rallies ? Am i correct on this?
& if so – What makes you think that the rally is over?
So yes but will only sell into a decent rally – ideally i want it to test the pivot first so maybe tomorrow as it will be much lower. My change of direction is that I use various indicators on the daily timeframe – OBV, RSI, momentum to get a sense each day where the strength is – up or down. I see this drop off as somewhat abnormal as for a long time once a daily trend has positive or negative momentum it tends to hold for 2-3 weeks. This up trend has been much weaker and has now stalled/reversed – if we got a very strong rally like 70-80 points it would probably flip around again so not rushing to go short. I know the bit about the ISA deadline but if you look this time last year we backed off then rallied up.
Forgot to add that still refining my method so still learning – and am not saying we are in a bear market – would have to be 200-300 points lower to start to convince me of that. So expect another rally up at some point but maybe from a lower base as the last dip to 6500 didnt go that low
Yes I agree with most or all of your analysis, except that I am more inclined to beleive that this move down is still within statistical probablities that an up-trend has not been affected. 1 hour and above charts have not been affected in the slightest
Yes I think that is fair comment. To expand – i do find my strategy goes into “no mans land” when switching between “up” and “down” and if I am honest that is where I am now which is why i am happy to sit on sidelines and not rush to short. So there is still potential to flip back up but another down or weak day would probably cement it form me. This works for me – as my ultimate aim is to hold for 2 or so weeks and catch a 200-300 point move. Ill only go in and come out within a day if the rally doesn’t really take hold. On previous rallies the up or down movement has run away with itself over several days with often overnight gaps (well not on SB as they dont generally close) – this up move just hasnt done this so far – hence found myself coming out the same day as I entered when resistance has held – but not my primary strategy
When you say your 1 hour hasn’t been affected what are you looking at to reach that view? The 4 hour view is showing a step pattern that often repeats itself (ie big dip down followed by slight retrace of 2-3 periods which is where we are now)
Shorted DAX 9500 and ftse 6585 This the moment you waiting for Hashmash?
yup ive got the short in on ftse, multiple, avg open 6587.3
Looking at 30 mins. charts, the following approximate support levels seem to be holding, at least for the present. Dow 16180, S&P 500 1837, FTSE 6550.
Yes I tend to be in your camp – I just think we had a bigger retracement but all supports are holding on the 30 mins charts
RobGreen,
to your posts above mentioning that 1h chart is no affected by this down move, clear to explain yourself please?
from what i see 1 hour is totally fked.
1h chart we can see this recent uptrend started around 6500 and we reached 6700 and now back to 6590..we have lost more than half the upside we got…
and if u look at daily charts u see markets curving off and dropping, but there is a supporting trend line around 6520
stopped at b/e
Hurray for patience, was used to the fast flowing market the last 2hours were painfully boring lol. Time to sit back and watch the footie =]
got my short sitting nicely on tomorrows pivot 🙂
market not moving much as well
posible top tomorow 6629 btm 6529 short order at 6625 limit 6530 nice if it works OMA only my assumption GLA
FTSE appears very bullish this morning.
If those over the pond rise today, we are in for a nice rally.
Hash are you still holding your short – when would you stop out. I am still in no mans land and holding no position – as you say this is such a tricky market at the moment. Was looking for resistance around 6630 but so far not giving it
Yes ive added more shorts….
you mentioned forthcoming news that you thought would pull this down – what is coming up that you think will do this?
my exiting/stop is around 6630ish but its not set.
I have max risk on right now :S
and ill close my short out if i see a lot of strenght at this 6630ish area.
It was the german export release (which came out worse), thought that would drag things down (DE being the biggest EU economy and all) but shit didnt happen…
Last trade on ftse…till we get out this fking messy range bound market.
lol i think the max profit i saw on this trade at one point (yesterday) was 4 points… and since then been in a loss..
quiet moderate loss right now.
I NEVER used totake more than 12-15 point in risk…but these days its just crazy…
bloody soo early in the morning as well that its soo high…dont wanna close out because i can reach B/E on this again during afternoon!
This market needs a shock to get out this hi vol range bound behaviour