
Good morning. Interesting day yesterday that seems a hard one to trade as it didn’t quite reach the main levels I wanted. Was all set for a short off the 10 day Raff at 6595 and it stopped at 6589. Typical! For today, support is 6540, whilst yesterdays high at 6590 is the resistance, with the FTSE looking to open at 6565. 6581 is the new top of the 10 Day Bianca, with 6617 above that for the 20 day. I am wondering if we are going to get another leg down shortly – gold rose yesterday for the first time in a while to break above 1200, whilst the S&P tested the 25ema on the daily at 1978 and dipped back.
Asia Overnight from Bloomberg
Asian stocks headed for a two-day gain as information-technology and materials companies advanced, with Rio Tinto Group surging amid optimism for a merger with Glencore Plc.
The MSCI Asia Pacific Index (MXAP) added 0.2 percent to 139.43 as of 9:04 a.m. in Tokyobefore markets open in Hong Kong. The measure added 0.8 percent yesterday. Rio Tinto rose 4.3 percent after people familiar with the matter said Glencore has been laying groundwork to buy the world’s second-biggest miner.
The yen held its biggest advance against the dollar since April as the Bank of Japan is projected to keep record stimulus unchanged today. Both Australia and Indonesia will keep key interest rates on hold at reviews today, according to economists surveyed by Bloomberg. Alcoa Inc. unofficially starts U.S. earnings season tomorrow.
“The yen bounced off lows last seen in 2008 as investors started to ponder the ramifications of the upcoming Bank of Japan policy-setting meeting,” said Tony Farnham, Sydney-based strategist at Patersons Securities Ltd. “Another earnings reporting cycle is just around the corner” in the U.S.
Japan’s Topix index fluctuated as the yen traded at 108.83 per dollar after climbing 0.9 percent yesterday. South Korea’s Kospi index added 0.5 percent. Australia’s S&P/ASX 200 Index slid 0.7 percent and New Zealand’s NZX 50 Index slipped 0.2 percent.
Protests in Hong Kong showed signs of winding down as pro-democracy demonstrators and the government agreed to start formal talks. Futures on the city’s Hang Seng Index and contracts on the Hang Seng China Enterprises Index were little changed in most recent trading.
Futures on the Standard & Poor’s 500 Index lost 0.1 percent. The underlying gauge slipped 0.2 percent yesterday as investors resumed a selloff of small-cap shares and investors awaited the start of reporting season to assess the strength of the U.S. economy.
FTSE Outlook
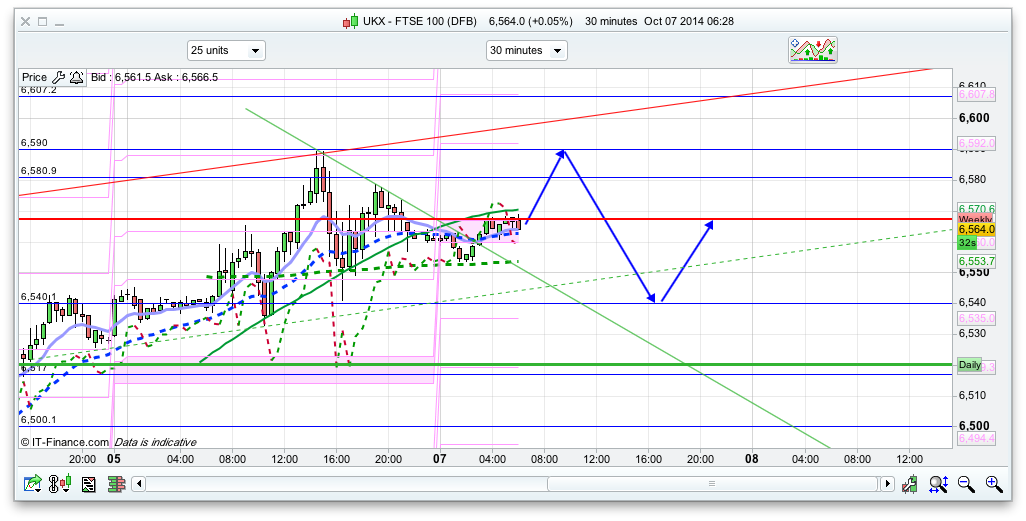
Today has initial support at the daily pivot 6560, not far below where we are due to open, so I have put an initial push up on my plan for today, to that 6590 area which was yesterdays high, however the top of the 10 day Bianca is 6581 – so 2 resistance levels in this area. If the bulls break that then 6617 is the next one being the 20 day Bianca channel top. I am kind of expecting a bit of a dip though, towards the 6540 area. If that holds that all well and good and then the bulls will build on this rise since Friday. However, if that level breaks then I can see 6500 being hit. Below that we have the bottom of the Bianca channels around 6440!
So, plan is initial climb off the 6560 level (pivot) to 6581/6590 then another leg down to 6540.
Key Levels to Watch
Support so entry levels for a possible long
- 6560 daily pivot
- 6540
- 6517
- 6500
Resistance so entry levels for a possible short
- 6581
- 6590
- 6607
- 6618
Ftse is heading for 6440 or lower it seems! Currently long dax (had no time yesterday to post) and probably will have to average that one as we fair lower following poor results in Germany. Guess we could get a test this week on DAX of 9000 but I do feel these are all buying levels, especially if the Dow keeps above 17k during and after earnings next couple weeks.
agree with you, bit more bears out there. I suspect DOW and SnP to hover around current levels until FED meeting, after that all the way up! FTSE in 6400 region and dax 9000/8900 region before turning bullish I reckon. If SnP does drop 40 odd points from current level, that would be bad for ftse and dax.
Divi for tomorrow is 1.8.
Divi cycle changes from Tuesdays to Wednesdays.
thanks for reminding me.
Morning All
– Gone Long 6525 – RSI+MACD Entry (5 Min)
Bit of a divergence on RSI/Price at the moment.
Gud moring everyone,
Hope everyone doing Gud ?
Gud morning Nick ,
Hope you doing well,
Are you open position with stop lose ?
How much it’s importent ?
Thanks
stop loss needed to stop your account being closed. It happened to me couple of times 🙂
Morning All
Morning Hugh
Thought I would post this for you.
Software – Gave a Sell at 6553 – right at open.
With targets 6528 & 6480.
I could only get 6549 for entry & just exited at 6525 ( panic really as I was not ready for this )
Could not post in forum – as trade was already under way.
I am posting this in reference to your trade entry
Hugh says:
October 7, 2014 at 9:22 am
Morning All
– Gone Long 6525 – RSI+MACD Entry (5 Min)
Bit of a divergence on RSI/Price at the moment
It may have relevance – Not sure.
Thanks RC …
Yes – I can see the sell in hindsight – B.Flag from 7:40 – 8:00 – Bang down.
Again – all the indicies look weak so I’m hedging out using 6480 as a target and 30 MA / 6534 on a 5 minute chart.
6480 App. = -2 Fib of yesterday’s Hi/Low (1 hr Chart)
6553 = Breach of 30 MA (1hr)
Morning long on dax at 9110 believe we are now getting into the but levels will see how this works out for a couple of days.
Buy levels
Hugh
Thanks – the 6480 as 2 x Fib Ext – interesting.
I am as well trying to work out the inputs for targets.
Determining the trend direction is important.
(Obvious or what !)
I’m finding
Price + 30 MA + 200 MA on a 5 min is good.
Up Trend – 30 above 200 MA
Dwn Trend – 30 below 200 MA.
JIM & PMS
How is your software fairing. If you are able – post a few of the trades generated. It will be interesting to compare.
Anyone see still more downside?
yes more downside after 2,30
Thanks, are you currently short nelly?
sorry 4 delay pal internet gone down.
yes short all the way its sentiment now not any thing else fear and more fear
Let’s see what happens here……..
FTSE 5 Min meets 30 MA @6524
Divergences on MACD and RSI.
Bianca/Raff channels on Renko ahead 6530 -6533
Overhead resistance 6530
Right Click new tab
http://s44.photobucket.com/albums/f25/FTSEDAYTRADER/?action=view¤t=display_chartimage_zps12e5f217.png
Long @15 holding on for 15-20 points but feeling nervous. Could it clunk? Personally want to be short this afternoon. Predict more downside on S&P’s especially ahead of tomorrow. FTSE usually follows?
Afternoon ML
Could I have your e-mail.
Want to send you a Spreadsheet regarding your strategy.?
Just to try & analyse it & perhaphs ??? look for some improvements
that can be adapted.
You do not use charts – to trade – Right ?
Jim.
One thing I still cannot figure out is why the transactions/orders list and also the chart, does not update until end of each hour. And not show the exact time, only the top of each hour shows the orders, but I know that the exit was made before the end of the hour
I’m using the 1 hour chart. The entry points are correct, when I make calculations regarding the spread and time (because, the entries are almost always in start of new candle, the trail stop is hit before the 1 hour candle ends). The exits I’m having difficult to understand, where exactly was exited, regarding the time.
For instance, yesterday I extract a sample of an exit. And instead of exiting with 1,2 point loss, it exited with 2.3 gain, with trail stop
So far the net profit is going as expected. Nothing to report…
Since 8:00 am 2eur/point :
+84.2
+45
+16.6
+34
trend still down
PMS – Hope this helps.
On back testing …you have the option to either wait until the close of the bar (and then open position at next bar open) or the other alternative is in “realtime”.
So …if you instructed the code it to enter on a “cross above” of the “bollinger band middle” in realtime – it would enter the trade when the price crossed the middle band – even though the hourly candle may close below it…
When you mentioned “only the top of each hour shows the orders, but I know that the exit was made before the end of the hour”
It may be an idea to check that all entries and exits are in “realtime” or candle completion. ( I’m thinking that you may have one or the other set to “Close” of the hour.
Not so. It opens almost always at start of the hour, because the trail was hit before the end of the hour… The orders list does not show the exact time of exit…
For ex: entered at 9:00 and trail was hit at 9:35.
The orders list is updated at 10:00 and will show :
entry : 9:00
Trail : 9:00
Short @ 6523
looks like a bad number 🙁
what platform u on
plus500
can you hedge on there ?
out 🙁 bad day to start
Any updates guys? Hugh, RC?
Senu – RSI >70 and MACD > 4 – nearly there ..
I’m really looking to close the Long from earlier at 6548 around the 200 MA – 5 Min
An update just coming in :
Short 9134,9 (9135,5-0,60-spread) at 12:00. 1 hour chart
Trail 4 points (9138,9 ?)
Looking at 1 minute chart, starting 12:00:
Price gone up as much as 9144, before going down.
Trail hit at 9127,6 (9127+0,6). What time ? 12:32 ?
pump and dump go on
nelly, what is the bad sentiment you have mentioned earlier?
Yes I can hedge.
Finally climbing up but I’ve bailed and closed. Next price 6505-6555.
Afternoon RC – my email is mlawrence_01@hotmail.co.uk.
I don’t use charts no but always open to suggestions and new ideas and ways to improve!
Cheers
Short @ 40, 7 pt stop
Not comfortable holding it. came out +2 🙁
40 Looks OK – Tgt 6529 – 30 MA 5 Min.
Thanks Hugh. Do you still have your hedge short open?
Yes
I actually need some decent trades – I’m getting very hungry !!
My bias is Long
Place your stops at a point that will indicate the trade is wrong, not by maximum willing to lose.”
Well Put ….Moazalia82
well said sir. I now understand the meaning of your earlier question 🙂
out of my two longs. Will long again at lower levels this afternoon.
What was that sudden drop all about just now? I missed something?
Hi Guys
Just an observation regarding the software signals.
It gives a Trade Entry
Then 2 targets
Not sure Why
I have observed that in most occasions it reaches the 2nd target.
Still testing the nuances of it.
Todays was – Sell at 6553 – right at open.
With targets 6528 & 6480
Already reached 6528
I do not know if this is the case every time.
Just something to consider
Probably the Algos are such that a profitable trade is always taken. ???
Just presuming. Then the actual target is for the end of the trade ?
All hypothsis.
Cheers RC. 6480 distinctly possible
one other observation – the 2nd target – often reverses the market.
Like yesterday – 6586 – which was the 2nd target.
So if this observation is correct – then 6480 should do the same !!!
More data required I suppose.
Ideas – The area of 6480 -6486
– Roughly 50% of base 6423 & recent Hi 6589 = 6487
– Was the break out price on Friday 6485 app..
Long @05
Nick
The frustration is – that I am unable to go behind the workings – so can’t see Why !
What is it that generates the levels? A spreadsheet?
Nick
There is a chart on the screen. The Entry – targets are shown as Lines on the chart. Also there is a seperate display with the results. There are no visual indicators on the charts – from which the signals are being generated.
Funny thing is that there is a module which ( if required ) color codes the price action.
Nick
I have retrospectively tried to analyse if there was any support -resistance from which the signal was generated. Pivots / Fibs / Larger time frame averages / elliott – but nothing seems to be consistent. Ofcourse – bollinger / keltner and smaller averages fit- but you would expect that – so I have discounted that.
The only thing which can project is elliotts & fib ext. & harmonics.
But will carry on scratching my head
Oh right, something custom you created?
RC-
Re:
Just an observation regarding the software signals.
It gives a Trade Entry
Then 2 targets
Is this perhaps – take half off keep the other half on….
Why suddenly drop. it is temporarily?
Wall Street open
missed this short at 2.30 so plotted a bounce off 16840-60 for 30 points just got out. all thanks to myself. got out as ema are not stable.
risky bounce off S2 has worked out, unusually.
Slight edge towards 1953 S&P500 ,
I think?
Didn’t have a clear head this afternoon. Wasn’t too happy buying at my bid so should have set a smaller target but got greedy and missed it!
S&P500,
1936
Target ,
What you guys think?
hmm, starting to feel a bit sorry for myself with my loooong position on the Dax. been averaging it and currently long at 9135 but at this rate I need to find a bit of extra dosh to be able to keep up with this slide! Still could be worse I guess.
RentalCollection — I’ve had my head down; back to the drawing board since the system totally missed an important selling point last Thursday. I have a lot of live testing to do, but it’s coming on. The example below shows the Dow since yesterday 08:00 (5 min. timeframe) — up about 220 points. Still in development and testing but I’ll try to post a few signals. I’ll probably be looking at some currency pairs too.
http://i1348.photobucket.com/albums/p736/jmca01/WallStreetDFB_zpsb3cd7d07.png
Looks good Jim..
Jim
Thanks
Looks very encouraging. 220 points – beats the socks out of the software i am using. Keep posting.
One thing to remember – Give it a lot of Real Live testing. You will find that you get some nuances that will suprise you. And please do post your trades as they appear. I think it challenges you.
Hope to see great trades from tommorow.
RC
Looks good Jim
Thanks all, I’ll keep at it!
Dutch think the Dax will go further maybe even try and take out the 8900 level have a long too but like you say could be worse.
Hugh
Thanks for your observation. Did not see that fib ext – so will transpose it onto my chart.
Think Ftse got to 6490 or so. 10 points short. Well still a couple of hours left i suppose.
FTSE 100 DIVIDENDS
With effect from Monday 6 October, FTSE 100 stocks will go ex-dividend on Thursdays rather than Wednesdays.
This means that any dividends due on the FTSE 100 index will be posted to client accounts at the close of the cash market on Wednesdays rather than Tuesdays.
This change is due to the shortening of the stock settlement cycle from T+3 to T+2 days, as part of the Central Securities Depository Regulation which has come into force across the European Economic Area (EEA).
email received from IG Index
Jim,
Do you still running the backtest ? Are you setting any targets or stop losses or trailing stops ?
Hi PMS — Still running. Sorry I can’t cast any light on the software problems you mentioned. Decided to take a very broad view and do my best to avoid ‘noise’. At the moment I’m running without targets or stops. Concentrating just for now on short time horizons, and mainly using a 5 min. timeframe.
Jim, can you extend any thoughts on what Hugh said about realtime or candle completion ?
Hugh
I have 2 conditions concerning trend changing to go long or short.
That code needs a timeframe as any other. If conditions changed from the last period to actual, it go long or short. If the code is in a 1 minute chart will go long/short only in the beginning of another candle and will stay until target, stop, trail or a sell/buy condition.
Am I right Jim ?
Hugh, do not understand what you mean by “realtime” or candle completion ?
You say I have the option to choose between one of them. Where ?
It needs a code to do that ?
THe conditions does allow to open in the next bar only. There is no “realtime”
I’ll message later ..
I think that’s right — I think buys/sells are triggered by default at the opening of the bar after the respective conditions are met, and terminated as you say. 🙂
Jim, but if you do not have targets, stops… set, how can the equity curve being like that ?
long versus short only ?
I see what you mean Jim. I’m a bit frustrated with this backtest program, as I saw a flaw this morning with my eyes and now had the confirmation from IG that are is in fact an issue with trail stops between It finance and IG and they are trying to fix.
I deleted all codes from stops, targets, etc… and the equity curve now looks a bit like yours (roller coaster). Since this weekend I thought I had found the pandora box.
But after some suspicions I had since Saturday, that was confirmed today.
It was to good to be true… I know I’m not a genius, but finding so easy a way to make money in a manner like that.
From 10.000 it goes to an 89.000 in a couple of years.
But even so I’m not quitting. I saw some progress and good possibilities.
As you I’m looking to a way of moving from the human touch (emotions) and all the human predictions. Now will go up… others now will go down. A crash is coming…etc
Jim I do not want to be boring…but I just place the money management by default, as yours and things look even better. But if you place the worse spread of the instrument you will be disappointed (7.2). But with a 2.2 is ok.
The worst problem I face now is the STOPS, TARGETS and TRAILS. In the end that’s what will do the overall performance. You might be right in the trend, but price has to move always with volatility, and any of the above code, if not placed correctly will damage all the good work you did.
Unless you stop the trade at a top of the equity curve 😀
But I like that approach you have. You are always in the market… long or short. 😀
That could be the future
you breath the market 😀
“The way of the future” as Howard Hughes last line
My equity started this morning with 11502 and is right now at 11708.
Anyone still long ? Long dow @ 810
Jim if I place the worst spread of DAX 7.2, the performance will turn negative since JAN 2013
hi RC, your second target hit 😉
Looks like a missed a good day trading today, heck you knows it’s bearish if even Tuesdays are bearish, but that could be cause of FED tomorrow.
Anyways can’t day trade currently
Average position long DAX 9136 with a running loss of -£3,440 @ £42 pp was at a nice round number before but couldn’t resist. Obviously it goes below 8900 I’m effed, but heck knowing the markets it’ll go for 8899.
But gl all.
Ahwab currently long on Dax too but this index is looking like its got further to go think it will take the 8900 level out this time in saying that RSI are very oversold so there may be a slight bounce soon.
Does anybody know what time is the news out tomorrow?
Ok, it’s at 2pm ET.
http://www.bloomberg.com/markets/economic-calendar/
Check the legend.
Haha motherf…. this is annihilation of the bulls, prospects are bleak at the moment obviously if push comes to shove will have knock some positions out with heavy losses. I’m assuming using IG figures as a microcosm that people are buying in anticipation of tomorrow hence the further drops. In this trading environment personally resistances/supports are void.
Jim
having some exotic test without stops and targets. Only going short after the long as done its work and vice versa
I tend to trust in Bill Gross statements, when he said some time ago, that people would be surprised by strength of US economy and caught with their pant’s…meaning with all those bonds.
Just ran system — FTSE/5 mins. Last trade SELL @ 6472/06:50. Might get caught out on open.
System says BUY @ 6483. Getting caught out by seesaw action. System needs to be on the right side of a nice run.
what time span are you using?
5 min timeframe, using data from 08:00 yesterday, running real time. Waiting on direction.
Morning Jim
I tweaked the software yesterday. Lets see what happens today.
Trying to see if More trades can be generated. But I have saved the
previous settings – incase.
Lets see.
Had a sell off yesterdays target 6483 – target 6461
Had a buy off 6468 target 6492 – Present trade
RC – Are those tweeks applicable to any particular time frame..??
Do you know what time frame is it working on ?
Now have a sell off 6492 Target 6461 & 6432
Hi RentalCollection,
I’ve now got a SELL @ 6473. Embarrassing — we’ll see.
Hugh
It does not matter what timeframe – I tried it on 5 mins 15 mins
30mins & 60 mins
Its only after 240 mins – that the signals turn off & some other signals
come on.
So I presume the algos work in Ranges of time 1 min to below 240mins
& > 240 mins. Longewr than that does not make sence.
Jim
Dont worry – Just post them as they appear.
Test it live. & then you will get the answers.
I’ll input as much as I can
I am sure others will as well.
I’m going to suspend reporting for a bit and hope it settles down later — far too choppy at the moment.
choppy PA on short time frames will always give out loads of differnt signals
Hopefully it’ll get the swing when it comes.
Hugh
Something else I have noticed.
Yesterdays target 6480 ( 2nd target ) – It picked it up today
as a sell.
Also there are now 2 signals – The Buy – which it is currently on
6468 – & the target of that 6492 – is the next trade – Sell @92.
Fascinating.
Gone Short 6482 using Pro Realtime Trend Lines on 5 min.
RC- Sent you this chart direct from my system
Hugh
Got the chart
Which is the Pro Realtime TL
& what are the other lines.
Hi Gud morning everyone ,
You may think you are in the business of trading. But you are in the business of decision making.
Computa says : “*”
Expecting SELL signal — maybe next bar. But 5 mins flat and choppy for the moment.
SELL at 6469.
Hugh Jim
Todays page open