
Good morning. Wow, I mentioned 6440 area as support of it all went pear shaped for the bulls, as it was the bottom of the Bianca channels for yesterday but didn’t actually think it would get hit! Would have loaded up massive shorts if I had! Was one of those pain in the behind trending days yesterday (unless you are already on the move and just run it with a trailing stop). The drop was on a reduction of the global growth estimate (with a bit of Ebola worry thrown in too!), though the International Monetary Fund says the UK will be fastest growing economy in G7 this year, though rising house prices in Britain are a concern. The drop on equities did mean that gold managed to hold above 1200 though. 6430 is support today, but it does still look poretty bearish and the bottom of the Raffs extend down to 6317 for today.
Asia Overnight from Bloomberg
Asian stocks dropped, extending a global selloff, and oil dropped amid concern that the global economic outlook is worsening. Treasuries fell and Standard & Poor’s 500 Index futuresrose with the dollar before the Federal Reserve releases minutes of its last meeting.
The MSCI Asia Pacific Index fell 1.1 percent by 12:49 p.m. in Tokyo, as Japan’s Topix (TPX) index dropped toward a seven-week low. The Shanghai Composite Index added 0.3 percent and China’s yuan was little changed after a week-long holiday. S&P 500 futures rose 0.2 percent after the U.S. gauge’s lowest close in almost two months. Ten-year Treasury yields rose two basis points after tumbling yesterday and the dollar gained against most peers. Gold rose 0.3 percent while Brent crude was near a two-year low.
The Federal Reserve releases minutes of its last meeting as Alcoa Inc. will report earnings amid reduced estimates for profit growth at U.S. companies. A gauge of China’s services industries fell as markets there reopened after being closed for a holiday since Oct. 1. European Union leaders meet in Milan today to discuss fiscal policies after the IMF cut its global growth forecast yesterday and warned about risks posed by geopolitical tensions and “frothy” stock markets.
“The global economic recovery has proved yet again to be fragile and uneven,” Shane Oliver, a global strategist at AMP Capital Investors Ltd., which oversees about $131 billion, said by e-mail in Sydney. “The rough patch we have seen in shares lately could go a bit further.”
The Topix slipped 1.5 percent, set for the lowest close since Aug. 18, as the Nikkei 225 Stock Average retreated 1.4 percent. The yen, regarded as a haven by some investors, dropped 0.3 percent to 108.37 per dollar after gaining 1.6 percent over the past two days.
South Korea’s Kospi index was little changed and the S&P/ASX 200 Index in Sydney lost 0.9 percent.
Hong Kong
Hong Kong’s Hang Seng Index retreated 0.7 percent as the Hang Seng China Enterprises Index declined 0.9 percent. The enterprises gauge, which tracks mainland Chinese stocks listed in the city, gained 1.5 percent in its three trading days since Sept. 30, with pro-democracy protest leaders agreeing to start talks with the government Oct. 10, even as blockades remained on Hong Kong’s streets.
The MSCI All Country World Index dropped 1.9 percent while China’s markets were closed. The HSBC Holdings Plc/Markit Economics China services purchasing managers index fell to 53.5 in September from 54.1 a month before. An official non-manufacturing gauge for the country released Oct. 3 dropped to 54 for September from 54.4 in August.
IMF Report
Growth in the U.S. is helping lead a worldwide acceleration that’s weaker than the IMF predicted 2 1/2 months ago, the Washington-based lender said yesterday as cut its growth outlook to 3.8 percent for 2015, from 4 percent. Some financial markets may be overheating after a sustained period of near-zero rates, according to the report.
“Downside risks related to an equity price correction in 2014 have also risen, consistent with the notion that some valuations could be frothy,” the IMF said without naming specific markets.
The S&P 500 dropped 1.5 percent yesterday, while the Nasdaq Composite Index slid 1.6 percent. The Russell 2000 Index of smaller companies lost 1.7 percent yesterday, the most since July 31. The Dow Jones Industrial Average slid 1.6 percent, also the steepest one-day loss since July.
The MSCI All-Country World Index declined 0.2 percent today after sinking 1 percent last session to its lowest level since April 15. A gauge of emerging-market equities sank 0.5 percent. Shares in Jakarta declined, with the benchmark index there dropping 0.8 percent.
Fed
The Federal Open Market Committee is due to release minutes of its Sept. 16-17 meeting later today. Investors have been concerned the central bank may increase interest rates sooner than anticipated as the U.S. economy gains strength.
Forecasts for the Fed to raise key rates in mid-2015 are “reasonable” as policy makers wait for unemployment to fall further and inflation to accelerate, New York Fed President William C. Dudley said in a speech in Troy, New York.
FTSE Outlook
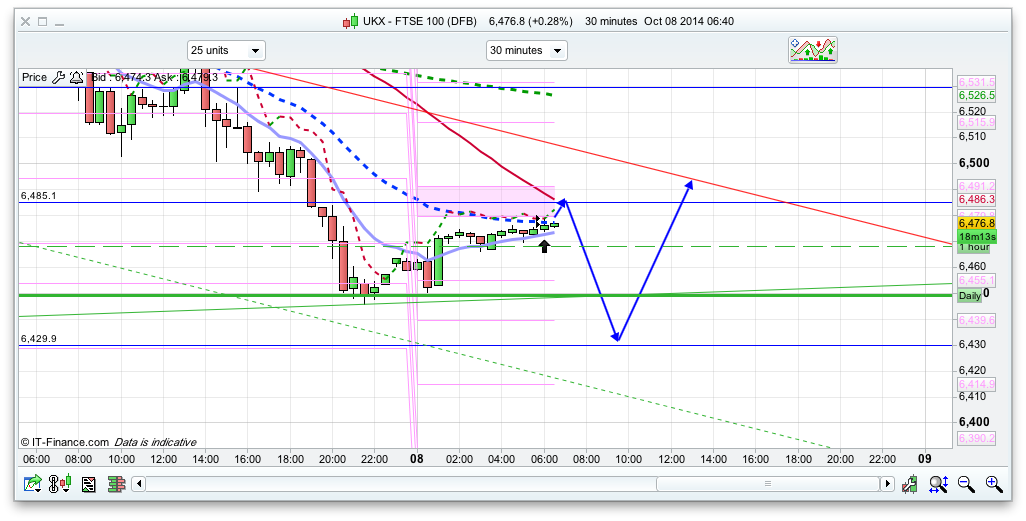
The bulls need to break 6485 to have any hope of pushing higher today, with the daily pivot at 6518 being the next resistance. A long at 6492 to target that pivot and 6530 might be fruitful if we get a bit of a dead cat bounce today – it has risen ok overnight from that 6440 area after all. The bulls have failed to break the 10ema on daily on 3 occasions since the cross to bearish on the daily chart, which is now at 6550 – this level will be the one the bulls need to break to cancel the immediate threat of further downside (the 10 day Bianca channel top is 6556 so 2 main resistance levels here), though 6641 being the 25ema on daily will likely see more selling pressure. Big picture then still looks weak, with the Raffs at 6315, and the Bianca channels at 6400, levels that it probably wouldn’t be surprising to see now! The bulls can still salvage October for a stronger ending though.
So, for today… Looking at 6485 as resistance for a dip to 6430. If the bulls break 6485 then 6518 and 6530 are resistance, with 6550 above that. If 6430 breaks then 6401 (10 day Bianca) and 6320 (Raffs).
Hi Guys
Fascinating.
Present status of all our charts –
Hugh – Sell at 6482 – Got your chart – Could you define the lines please
Jim – sell from 6469
RC – Buy – 6468 – target 6492 Present signal
Next signal already in place – Sell 6492 – No targets for this so far.
” Could you define the lines please”
They are generated lines by Pro Realtime –
It automatically generates Trend Lines and S & R Lines.
Things will look up quickly if we head for Nick’s 6430 — which looks like it’s on the cards.
Any thoughts on timeframes? Seems to me a 15 min. timeframe would cut out a lot of this nonsense I’ve been getting this morning. In 15 mins., Linreg 50 is just peaking and SMA 200 has a negative gradient.
Jim
Have you designed your system to project Targets ?
No RentalCollection — I have been wondering how your system manages that! Curve fitting techniques maybe?
Nick said: “A long at 6492 to target that pivot and 6530 might be fruitful if we get a bit of a dead cat bounce today”
Are you sure you meant 6492? Maybe 6429?
yep 6429
Well getting to greedy yesterday has come back to bite me! Also couldn’t trade first thing for various reason so missed my price @65. Get it next time aye. Good luck all!
RC i’ll get back to you as soon as i can!
Jim
Why dont you run both – 5 & 15 & post the signals from both. in Real time.
I’ll see if that’s permitted — I’m doubtful!
You can open two charts Jim – one 5 Min and another 15 Min with the back test running.
Hi All going short again around 6495-6485-6475 but defo staying short
short now will add when ready.. good luck All
Any targets for you shorts?
6400 going in to the evening close at 8 45ish
Got a buy at 6455
short 6545
FTSE (PRT) 5 Min
PRT stands for Pro Realtime
Support Broken 6469
Resistance Now 6468
The Next Support on PRT is 6449
30 Min & 1 Hr
Ditto – The Next Support on PRT is 6449
Thanks Hugh — makes sense.
Hugh
What exactly is the Pro-Real Time. Is it a trend following Indicator.
I see you using it as a support – resistance beacon.
My system – seems to be firing on all barrels. The 5468 Signal from 2nd trade still active.
But a new Buy Signal Fired at 6455.
Hope I have not broken the system. But as all good research goes – you cant call it off just because its not doing what you want it to do. It may suprise all of us ?
JIM
Any further signals?
Reference – targets – Why dont you try using Band levels as targets
Still short; last signal was at 6473/09:30. System has recouped some of the ground lost; up about 60 points since 08:00 yesterday.
Hugh / Jim
Whatever changes I made to the software – Has had the effect of making it sensitive to smaller moves. But still open to learn. I can still go back to the previous settings or learn from this to get a mid-settings ? Any suggestions welcome
JIM
Is your system having Peer to Peer
Buy – Sell Signals Only
It gives buy, sell and stop-out signals. Not sure what you mean by ‘peer to peer’.
Jim
P-P
Buy becomes a sell. sell becomes a buy
Sorry Jim
I seem to be behaving like the software – hyperactive.
An exit is generated by the next opposite signal.
So exit Buy at Sell signal – which then is the trade direction etc.
Yes, that’s so, but one can programme additional exit conditions also — always something to consider. Re timeframes, guess it’s swings and roundabouts really. My own view is that it is vital to capture good runs when they occur — that is where the points are built up!
Jim
Could not agree with you more.
I think I have made the software very sensitive,
& it may not yield the results. However the software
seems to b generating multiple signals !
Fascinating
Hugh says:
October 8, 2014 at 9:58 am
” Could you define the lines please”
They are generated lines by Pro Realtime –
It automatically generates Trend Lines and S & R Lines
Looks great. Pls keep posting. thanks
Video for you RC
https://www.prorealtime.com/en/video-58-pop
Thanks
Will view it later today.
Your 6455 holding RC (Its also a fib level).
Nick
I think I have made the system too sensitive.
too many signals. The previous settings
had me very relaxed – while the signals fired,
and the targets were preety large & generated
good points & ££ susequently.
But lets see – This may suprise all of us.
have to agree with you,your previous set up sounds better. Too many signals can cause chop chop in sideways markets.
BUY at 6466.
RC, that was a nice buy call earlier!
Definitely!
RC, your buy 6455 was quite an impressive suggestion. pity it wasn’t based on any analyses of indicators, patters or other things possible. cos software could give a lot of false entries too.
patterns
Long @65 got nervous and closed @85
55-05
looking to short at 90
It didn’t get to 6429 I wonder if Nick took long any higher than that?
6455 🙂
Hi Chaps
Just came back, Wow
This software – is full of suprises.
I really thought – I had flunked the settings
& it was going to be embarassing.
Really Fascinating but!!
whats the latest signal RC?
Jim
Any new signals on your side
Sam
Long all complete at 6492 Target
The signal now is a sell at 6492 – which the software
pulled out of its bag at 8.40 or so,
Cheers RC, 6492 is spot on.
Am short from 90 and closed half at 80 rest to b/e.
RentalCollection —
The system caught the long @ 6466 but gains are now about 15 pts. off the top in the absence of a SELL signal. Possibly imminent! 🙂
Jim
Thats great. Are you running both 15 & 5 ?
Not yet RentalCollection, but I’ll give it a try soon — pushing the envelope! The period 07:00-09:30 this morning was damaging; yesterday’s gains were eroded and I got fed up trying to keep up with the seesawing. I shall try a new idea this pm using the Rminmax bands.
Got SELL at 6476.
Jim,
You mean short at 6476??
How many points?
Yes, but undecided atm.
Jim, RC
Given up of using stops also(found a new flaw in the software- that guys in IG are kids, not warning people about it – that’s why I still running the backtest )
So, since this morning, looking for conditions to exit or only long versus short.
Looking at statistics, right now, seems the long versus short, beating all the others.
Since Oct.1 system is giving , with one position in each index (sell) still running :
DOW 1 hour chart – 388.8 points
DAX 1 hour chart – 429 points
One positive progress in my system :
DAX did not give me a buy signal in the dead cat bounce, start of October.
DOW gave me signal to go long but was changed to short, with a loss of only 17,3 points, which protected me of the usual dead cat bounces
I’m staring to like this way of trade, but is toooooooo early yet.
Looking to other types of exit. One had almost the same result as the Long vesrus short… but those statistics are very difficult to study and not very trusted.
SO I given up of old historic data.
And running with real time and recent data, so I can understand the moves
Tried 3 longs, at 2.34, 3.08 and one in between, 1st 2 closed at b/e. I thought it was going long to pivot 17800. 3rd one I pulled out with 30 points profit. It looks like it’s not going up after all. interesting scalps.
Hi Jim – Not sure if you saw my note earlier…
Just incase you missed it!
Hugh says:
October 8, 2014 at 10:06 am
You can open two charts Jim – one 5 Min and another 15 Min with the back test running.
Reply
Hi Chaps
Is anybody Short off the 6492 signal ?
One short position open at 6610.5, still running
yup, am short from 6492 just added more at the same level. Stop at 6500. looking for 6430 or lower.
Hi Sam
Just to bring you an update from system.
The sell Signal at 6492 – is no more – Its Gone from System.
There are currently no signals. There is no Buy signal either.
So not sure – !! Just an update
agree short ftse to 6430
cheers RC. Been taking profits and set to b/e.
I’ve got a few Shorts lower down RC – but that’s a different story…
6490 – 1 Hr PRT Trend Line resistance
I was broadly positive as the FTSE and averages were above the 200 MA on the 5 Min – but see the DJI is kicking off again ..
I have 6449 as the PRT Hot Zone
& 6468 as a minor Support Area
S&P500 Slight edge to the downside towards 1919,
I think ?
quite possible.
might even bounce off 1900ish area too.
still holding shorts will add after 6470 breaks
yes – 6470 – is a strong area of Support…
6459 is even better
waiting for it to puke
Hugh
Cool
Hugh says:
October 8, 2014 at 3:48 pm
I’ve got a few Shorts lower down RC – but that’s a different story…
6490 – 1 Hr PRT Trend Line resistance
I was broadly positive as the FTSE and averages were above the 200 MA on the 5 Min – but see the DJI is kicking off again ..
I have 6449 as the PRT Hot Zone
Reply
Hugh says:
October 8, 2014 at 3:49 pm
& 6468 as a minor Support Area
_________________
The 6492 Sell which the software signalled – did not give a target.
Also it turned off just after 2.30pm.
No new signals – Sell or Buy.
Dont have a clue.
Looking at market – it seems to be going down
& Nick has it going to 6430.
this ebola will send things south
Poor DAX hammered again!
Hi Guys
Which of the indicators would you say
measures momentum?
Short @00
stop hunting 🙁
Wow
Just amasing – was not looking.
The Software gave a buy at 6468 at 4.20
with target 6502 & 6512
Scary
I think the algos may be mearusing rising or lowering of momentum
Hugh
You have a Dotted Green Horizontal Line at 6468
What is this pls.
Pro Realtime – Intermediate Support.
How was your trading todauy.
I did not take any of the signals – As was testing
new settings.
Must say – different but still bloody good signals.
The fact that there was no signals from 2.30 till 4.20
I feel can be only because of a lack of momentum
and ” it senced ” ( scary right -) and it worked out it was a
sideways move. Buy when the momentum rose it signalled at 6468
— suprises all round.
Not sure whether to keep these settings or revert to last one.
Any comments on this ?
As for now – we are on a buy from 68 – with target 6502 & 6512
Hi Hugh — Thanks, I did miss your earlier post — I usually have 3 charts open in different timeframes, while the backtest runs in one of them. Do you know if it’s possible to run backtests in 2 different timeframes at the same time, or for 2 different instruments simultaneously? (I suspect not but haven’t tried yet.)
sorry to but in
How did the software fair today in real time?
..butt-in..
Yes you can, but Jim, you should press those guys on IG or Prorealtime.
They playing with us. Read what I receive from IG :
Please note that with ProBacktest everything is carried out at the end of the candle. Please remember that the ProBacktests do not run on real time ticks, as IT-Finance do not hold this wealth of historic data. Therefore, if you run the a Backtest on a specific time frame (4 hour for instance), it will always only look at what happens in the four hour candles, and not use any of the information from the lower time frames. If for instance a trade was to open whilst running the Backtest on the one hour time frame, if you stop loss and take profit were to both be hit within a specific one hour candle, the Backtest will always choose the take profit over the stop loss. It will not utilise the 5 minute data, to see which of these came first.
I send a dumb question, to those morons :
In the Auto trade it will behave in the same manner, I suppose ?
But backtest is only a backtest, but should reproduce the real trade. If not, why all the trouble with those statistics, reports, etc….
Jim what comments have you ?
PMS
– They have a manual on their website which is well worth reading and digesting.
– As I mentioned sometime ago – all back testing is limited somewhat by your own programming skills.
I’ve seen some code for ProRealtime stuff and wow ! …it can get very very complicated…way beyond my capabilities.
( Just in passing – it’s not really fair to have a go at IG Index – they only provide IT Finance charts under licence and also IT Finance do provide a programming service for a fee).
Still short on DOW, DAX, SPX (1 hour time frame) and FTSE (2 hour time frame).
Testing it.
Positions will change to long ones, when conditions are met.
but the sideline markets are the tricky ones. That will be the real test, not now or dead cat bounces. This last already had it’s test and worked ok
me 2 think more down side
I cannot see anything on Wednesday till now at 7 pm from 3.30 so when I was opening the charts now I felt it would be a surprise. And it was. My long would have come out well after all. But obviously I would have needed to re-enter between 4-5pm. Nice food to hindsight, but I am unable to trade on Wednesday between 4.30-5.30, 6.00-7.00 the last hour has been filled with work, I couldn’t say ‘no’ “sad”
basically if nothing happens before 15.30 I get nothing. it’s my life.
But I have Tuesday free and obviously Friday. Thursday tricky sometimes but has more room.
I wish that a trend established as fast as it could before 16.30 (today pitifully I was busy from 16.00 usually it’s from 16.30) so that I could hold it a trade for a day and then check. But today the signal for upside actually appeared only at 16.50, a proper one, but I was completely and utterly unavailable. How would I know that the long 16703 which I had (the 3rd one) would go into profit if the signal for short was issued by other parties so I had to cut off the profits.
It was going through support, I couldn’t ignore that in the current short environment.
ps.ed of basically.
Do you know if it’s possible to run backtests in 2 different timeframes at the same time, or for 2 different instruments simultaneously?
Jim – I’ve just tried this on mine – no problem at all….
Brilliant Hugh! 🙂
Today was very difficult but system has recovered as of now to ≈ +75 pts. since yesterday morning. I didn’t manage to better that this p.m. trying a different approach. I’ve been in and out of the system so this has meant recalculation of parameters, but I couldn’t suspend development at this stage.
BUY @ 6488 doing well — now up to +84 points.
Jim – This sounds promising as I like the fact that seems to be trading with the trend.
Is it me or is this rally not just the perfect opportunity to short again? Markets rally on what could have been the only outcome, a fed discussion on how to manage a rate rise. Soon the focus will be on other matter surely. What does everyone think?
Thought you were adding Longs Dutch ???
I was Hugh and I could now finally get out of most of that mess with this 100 point gain on the DAX. Long term buying is still good below 9000 I would say but happy to make money on the way down too, not you?
Certainly tempting….9165 ?? See chart
Hope this link works – this whole board seems slow tonight..
http://s44.photobucket.com/albums/f25/FTSEDAYTRADER/Mobile%20Uploads/?action=view¤t=display_chartimage_zps77aa150e.png
Well that was coming. 9034 is my b/e on DAX @ £55pp. Then onwards and upwards 🙂
Jim – You’re setting this sounds promising as I like the fact that seems to be trading with the trend.
Hugh, though I’m not shorting that 9140 area looks good too…for a short that is. Personally a 300pip swing on the DOW is overdone.
Nice trade Ahwabubbly
**oops””
Jim – Your setting on this sounds promising as I like the fact that seems to be trading with the trend.
Haven’t finalised tactics yet Hugh, but it seems to be reasonably good at catching trends where they are present.
Hugh, if IG supplies customers with a product, they should advise and warn the customers of flawless software. I had to find for myself those flawless and waste tons of time… and only after I saw for myself, and only after I received an email from IG saying that there are issues with platform, concerning stops, targets, etc. in the backtest…
For instance, if I was a more relax guy, you imagined after all that performance in Backtest, switching to Autotrade and find myself loosing and not understanding why ?
PMS – Perhaps take the time frame down to 15 Minutes or less.
Hi Jim
Still in backtest or running already the auto trade 🙂 ?