
Good morning. Wow, that was quite some drop yesterday that blew that 6509 long right out of the water, and kept going to get a low at the 10 day Raff at around 6435. Having reached that level we got a bit of a bounce in the early evening to 6480 were we look like opening at. The bulls will need prices above 6565 to confirm thats the bottom, they are going to have to fight hard for that. It dropped yesterday on the ECB press conference from Draghi and also deflation fears – which is what is effecting the supermarkets at the moment.
Today is Non Farm Payrolls (NFP) so at 13:30 that will create some movement. If ADP from the other day is any sort of indicator then NFP might be good. Which will probably make the US indices drop!
Asia Overnight from Bloomberg
Asian stocks dropped for a sixth day as the yen held two days of gains, curbing the earnings outlook for Japanese exporters. Trading is due to resume in Hong Kong following a two-day holiday.
The MSCI Asia Pacific Index (MXAP) declined 0.1 percent to 138.35 as of 9:00 a.m. in Tokyo, before markets open in Hong Kong. The gauge is down 2.6 percent this week, on course for the biggest weekly drop in six months. The measure has retreated 7.4 percent from a six-year high in July.
Pro-democracy leaders in Hong Kong said they will escalate protests if their demands aren’t addressed. European Central Bank’s President Mario Draghi said the central bank will buy assets for at least two years to boost inflation and economic growth in the euro area. U.S. jobless claims unexpectedly dropped last week, data showed yesterday. A report on American payrolls is due to be released today.
“Most world stock markets are currently in a correction,” said Monty Guild, chief investment officer of Los Angeles-based Guild Investment Management Inc., which runs global equity funds. “Many developed and emerging markets will be declining as investors withdraw funds to shift to U.S. dollar assets.”
Japan’s Topix index slipped 0.1 percent as the yen traded at 108.46 per dollar. Australia’s S&P/ASX 200 Index sank 0.2 percent and New Zealand’s NZX 50 Index fell 0.2 percent. Markets in South Korea, India and China are closed.
Hong Kong Chief Executive Leung Chun-ying, the city’s top official, refused calls from the protesters to resign, while offering student leaders discussions with his deputy Carrie Lam. The students, who are demanding China withdraw plans to vet candidates for 2017 elections, have said they will focus on political reform at the talks.
As investors assess the health of the U.S. economy, analysts are predicting a return to gains of more than 200,000 in nonfarm payrolls. The Federal Reserve, which is on track to announce the end of its bond-buying program this month, is assessing whether the recovery in the world’s largest economy is strong enough to withstand higher interest rates.
FTSE Outlook
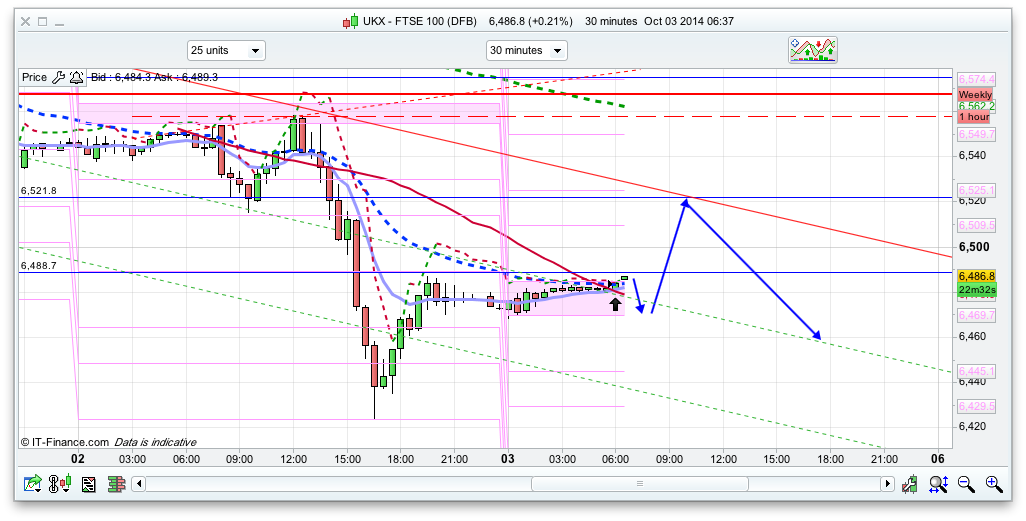
After that fall yesterday I wouldn’t be surprised to see a bit of a rise to the 6521 area before another dip down. Initial resistance as I write this is 6488, so we may get a little dip from here to the 6475 area, where we have the bottom of the 20 day Bianca channel for today. That said, the bottom for he 10 day Raff for today is 6395 – and the touch of the bottom of that channel yesterday at 6435 held fairly well (slight overshoot but it rose back). 6525 on the FTSE might well tally with the S&P hitting 1955, which is looking like a fairly key area. Of course a lot will depend on NFP later on today which will determine the afternoon session, but it looks like a short at 6521 should be good, but long until that point. If the bulls break through that resistance then they will be targeting 6565 next and a break of that area will probably turn things around and that last night 6423 was the low for the moment.
So, bullish till 6521, then bearish for another leg down but with a stop at 6532.
Keep the stops tight and don’t forget its NFP today!
PMS — Wondered if you managed to install that code, Rminmax, in your ProRealTime setup.
Good Morning All,
Does anyone trade intra-day contracts ? I have sold FTSE with a maximum risk of 8 points today. The maximum profit is like 85 points with the spread if it ends in your favour or you could come out using the volatility. I tend to do this when I see the risk/reward ratio is high and there is high probability especially on news days. I did one last night on the Dow by risking 10 points opened it up at 8.58 pm and it ended up in my favour just under a minute as the market closed with 87.5 points profit which is a very nice risk/reward.
Any thoughts from anyone.
I don’t RJ but sounds like should look into
Not sure exactly what you are referring to but I guess they are 1 day binary contracts.
Similarly I bought a Dec 6750 call for approx 40. Currently 21% ish delta. I sometimes buy options when want to take advantage of short term volatility but limit downside risk.
Hi Javed..I use IG and its not binary options but its not DFB (Daily Funded Bet) as well. The expiry of this contract is the close of that respective market on the same day. for FTSE its 4.30 and Dow 9.00 UK time.
On the call options you mentioned, you will start making money for any point above 6750+40=6790 and your risk is limited to 40 x £Xpp. Is my understanding correct ? This is different to monthly or quarterly contracts.
Well my mistake its indeed the binary options.
I use these as well. Quite handy
yes Nick, if you pick the days its quite handy..
RJ
I will make mtm on the call option as soon as the underlying – in this case the FTSE moves up from the level at which I purchsed the option which in this case was around 6480. On the flip side I will incur time decay or theta as we get closer to maturity. In addition the volatility of the underlying will effect the value of the option…..volatility goes up so does the value of the option.
If I hold it to maturity in Dec then yws you are correct I will make money only if the FTSE is higher than the strike 6750 plus my initial premium – 40.
Thanks Javed. I didn’t know this, I thought you have to hold it until your options contract expired.
Theres your 6518 RC
Different types of optioms – European have fixed exercise dates, American any time before maturity and Bermudan options a cross between the two butdon’t want to confuse you for no reason about those.
Nick
Shold get to 6528
Just about to i think
Congrats for your targets RC 🙂
Short @ 6525
Nick
Yesterdays v shaped reversal from 6432 astounded me. There was a plethero of price levels from which the reversal could have taken place. But the software picked the right one.
Think we hit 6528 _ just heard my position close out from 6477.
Nice one RC, don’t know how many rounds your software would have won against black box 🙂
Yes nice one RC. I had 6435 as the bottom for the 10 day Raff, and it certainly bounced in that area. Whatever it is thats picking your levels seems very good!
Senu
Not me. I will pass your message to the software. 🙂
Gold touched 1200……next stop 1050, 900?
RJ
Yes I wish.
Looks like a trending day
but which way
still holding today’s up move. is it still more up?
Ahh targets all met! I’m done
nick what size stop loss are u using, eg for the trade short at 6520 what was your stop
Hi Varies to be honest, usually anywhere between 8 and 20
Senu
You still holding ur long ftse ?
short from 6525 🙁 stopped out @ 35
Gold dropping and indices are pushing up…..end of bears?
dow heading for 17k today
Hi Jim.
Did not tested yet, as mentioned earlier, had problem with syntax.
Can you paste again here to see this weekend if I can look closer.
Meantime my FTSE holdings are to stay for a while, until I’m satisfied.
I managed also to profit yesterday from SPX. 10 points. I saw in afternoon a lot of buyers when 1925 was hit. +- 5% classic correction on SPX this year.
Also the daily candle speaks for itself.
We may have seen the bottom. But if it drops again I will be a buyer. No shorts now
down turn 4 ish
Yep everyone come on board for the bull run now. The cash registers are going to be ringing loudly on Black Friday and then Santa will start to dust off his suit.
Of course more than few bumps in the road to come but yesterday’s 6435 could look very cheap by the end of the year.
Jav what you thinking more down side
yes javed, i have one lot of Long at 6435. I will be buying 4 more lots on dips and hold until year end.
I also had a so so day. relaxing day. Lost on NFP open -77.5 points (3 trades in a row), took wrong trades, didn’t stick cos they were wrong, closed losses. I think I took short at first and lost, then I took long and it got up a bit and started dropping, so I think I closed that one as well. Had long 16906.5 it was closed b/e. So I took another one at 16907 which I had and experienced a fall to 16862.5 and rise to 16968.5 on which I closed +61.50 points. If it went below 16862.5 it would be a overall loss and mistake in direction but it didn’t. So still in a total loss of 16 points or quid, but had an overall fun, didn’t have any emotions on a rise and on a fall. I may have done some stupid mistakes as I didn’t use my heart, so I need to correct it in the future. Made a mistake, I have to admit with rushing just after the open 13.30 short which I wasn’t convinced in, whereas if I waited could have gone in at 16885 long as I should have at 13.31. Just a bit of wait… and everything would be even better.
I did win yesterday 41 quid which is I think 30 points with help, so I was very pleased.
short of that 16972 could have been all right now. I think you guys were waiting for this short on FTSE.
Hi PMS,
Just copy and paste the 4 lines of text between the dotted lines below as before. Hope you get it to work. Rminmax goes in the indicator name box at the top of the screen.
Best, Jim
…………………………………………………………………………………………………………………
// Rminmax
rmin = lowest[n](close[1])
rmax = highest[n](close[1])
return rmin as “Rolling min.”, rmax as “Rolling max.”
…………………………………………………………………………………………………………………
FTSE 5 mins —
http://i1348.photobucket.com/albums/p736/jmca01/FTSE100DFB_zpsf03f7c0c.png
thanks Jim… Can I test without activating my cash account ? Or do I need to create a demo account ?
NICK
Your market projections was roughly what i thought it would do today , with a sell off to yesterdays lows
This software gave no sell at where I thought it would sell off from 6500 area. I have learnt not to go against the software signals. Look at the price now 6528 area. As you remarked earlier the algos within the software sure does a good job of picking the trades. Only good high probability ones. I had the best week ever in my trading career , just over 400 points @ 10 / point . The best thing about it is that i feel confident and relaxed with the trades and just wait for the target to get hit. Just hope it keeps on working.
Jack, you still holding your dow short? Friday evening 🙁
Oh, no, I recovered on long +61 points so the loss is only -15 points now (pounds). I entered at 16933.5 long briefly at 4.03 pm and should have held but it started dropping so I closed for +2 and called it a day. but it got to 17000 now. Oh, well, stuff happens.
I do have a total loss of 28 pounds for this week. But hope to win it all back in future weeks.
Hey rental, would you consider posting your signals as and when you get them? Would love to focus on your system
HI RC. Did your software catch any signal at 16:50+- yesterday, when SPX found a lot of buyers ?
Nelly – not expecting more downside…..though of course there will be dips. A lot of support around 6435. How often did we see it bounce off that level last year? Too many.
I personally think yesterday was a godsend…that’s why I dipped my toes further with a call option. I still think 7000 at year is only although sound a bit crazy….but regardless more plausible is that we finish October positive ie greater than 6625. If we do then 6435 will look very cheap as Nov and Dec are likely to be positive.
*7000 is on at year end.
Apologies my typing is terrible these days as I use my phone.
PMS — Installing Rminmax allows you view it against price with any selected instrument. It is an indicator, not a query. You could though build queries using it if you want to do that — you would have to formulate criteria for BUY and SELL conditions. At the moment it’s just a visual aid. You can view anything you like in IG/ProRealTime free of charge provided that you make at least 4 trades per month, whether or not you use ProRealTime to do so.
Ftse just completely split from Dow and S&P then. Like 10 points. I’m making too much money back from my hefty losses this week!
Sorry Jim, the same problem again. The word “return” have some syntax error. It not validate. I need to read the manual to understand the basics of this programing
What a fun packed week not just because of markets but also because of things happened in this forum 🙂 A lot of opportunities to trade either you would have made a lot of money or lost quite a bit..personally I made around 185 points this week. One of the things in my list is to reduce the number of trades I take per week and its a good progress.
Have a good weekend all !!
X2wlt, how you make the money back ? What is your stragice? Any tips?
You long ftse and Dow?
How your see the ftse till year end? 6900 or continue drop to 6200?
Yoohooi I’m only halfway back after losing very heavily on Dax ftse and S&P. Had to sell my long term apple position too. Jumped back into ftse small but added aggressively yesterday evening as it recovered. Expecting 6500 to be a base now. My stop is just below here. I will bring a stop up behind rather than selling assuming we rise over 6750. US will create 17k base on Dow and 2000 S&P soon I feel
Pls could I have your email. Thank
PMS —
1. Click on button Indicators and trading systems in the top margin of any chart.
2. Select tab indicators.
3. Click on New. (Extreme left immediately above List Box.) This opens ProBuilder – Indicator creation.
4. Paste the code into the large text box Programming of indicator.
5. Add the variable n in Variables.
6. In Indicator name in the top margin, replace the default name with Rminmax.
7. Finally, click on the button Add indicator to chart; bottom right.
8. You will probably want to reformat the indicator (remember to check Set as default configuration for this indicator once you have completed formatting), and add it to the Price chart, rather than having it in a box below.
9. Fingers crossed! 😀
Hi Jim
I had a small read in the manual and create a backtest program with a 0,52% net profit for a period since start of the year in the 4 hour chart :D.
I need to refine. It’s quite simple to use.
About your indicator, I pasted but the min. and max. now has syntax error.
If you tell me what you mean by min. and max. I could insert one of the thousands of functions available direct from the chart programing
By the way… your other backtest, how was that statistics in the final report ?
Jim, I used a 5 min chart backtest for example in 29/9 (from 8:15 to 16:15) with a code of my own and put a 50 point stop and trail stop of 2 points, to go long and go short with only 2 DAX EUR 1 contract…it came with a profit of 851 €. But IG has a trail stop minimum of 6 points. So I changed the code for 6 points and profit came to only 296 € for that day. I’m still learning this automated stuff. In the 4 hour chart the profits are even bigger for that day. And I made backtest since Jan 1 2014 till Set 2 and had a 290 % profit for 4 hour chart. Even so the 1 hour chart is the one that have the most profit with almost 400 %
Even so I think something is not right with those orders or the backtest… I think…
WHat are your experiences with that ?
THe profits change with timeframe
Can you give me more insight on those backtests concerning spreads, etc. ?
I placed 1.2 points spread and 28 €/contract (margin)
My Question :
Is there a way to move stop to b/e after price reached 15 points profit and only after activate a trail stop ?
X2wlt, what level you long ftse?
My average is 6474
X2wlt, what is your view on ftse 6750? You expect ftse at base level 6500? you say you on heavy loss ftse? You long ftse this week?
THis is my problem: (Chart 1 hour)
With Stop loss of 50 points and trail stop of 8 points, in the orders list I see :
Short at 9468,7 and exit at 9466,1 ( gain of 2.6 ).
How can it have closed my position if the stop loss was not activated neither the trail of 8 points ?
JIm I did not create any exit conditions, only entry conditions. SO only the buy and short are active. And also the stop and target, which uses the stop loss (50points) and the trail stop (8 points)
RC, Do you have any open trade on FTSE? What is your view ftse in medium to dec?
Hi PMS,
Re the indicator are you sure that you have the screen ProBuilder – Indicator creation? The text box where you paste the code is Programming of indicator.
rmin and rmax are defined in the code — rolling maximum and rolling minimum of close.
I use the backtesting system at a fairly basic level. Your system sounds very promising. I can’t explain the position closure which you describe — it might have something to do with spread settings etc. I leave those settings at default. There is a backtesting manual, new with version 10 I think. I have had no more than a quick look at that. It should be possible to move the stop as you want to — perhaps the ProRealTime people would have a look at your system? Sorry I can’t be of more help with this.
Hi Jim
Thanks. I will take a look at that indicator.
Meanwhile take a look at that link.
In bottom will see the report statistic( more than 800%) for the 4hour chart since 2012 DAX.
The best performers are DAX and DOW in the 2 hours chart. Made statistics for shorter time frames.
The problem I face now is stop loss and trail stops . The performance change drastically with those changes. Send email to prorealtime for help.
Right now have set stop loss 50 points and trail stop 8 for the 2 hour chart on Dax . This is the best time frame performer … Have otimizer also based on historic data.
Forgot the link
http://caldeiraodebolsa.jornaldenegocios.pt/viewtopic.php?f=3&t=83913&p=1150335#p1150335
That’s impressive PMS! Have you applied the system outside of the optimisation/training period?