
Good morning. Well you can tell the US isn’t too fussed about Greece as the S&P is nearly at an all time high. However, with the whole Greece situation today could be a trading day for the brave, or certainly with smaller stakes. The Greek proposals will be presented to EMU finance ministers at a key session of the Eurogroup on Wednesday. They are essentially a restatement of Syriza’s long-standing demands, with an added request for some fresh money from EU creditors to tide the country over until September. There is even talk of them tapping up the Chinese or Russians for money, rather than be beholden to the EU. Anyway, nice bounce off the bottom of the Bianca channels yesterday, and the bottom of the 10 day at 6792 should provide support today if seen, albeit during what could be a choppy day! Wonder how much further the US pushes on before it rolls over – usually only get so many days of “new all time high”, “buy shares before you miss the boat” and then it all drops. Wouldn’t be surprised to see a pop up to 6920 before a dip back.
US & Asia Overnight from Bloomberg
(Bloomberg) — The fourth 1 percent rally in seven days pushed the Standard & Poor’s 500 Index past levels where previous rallies failed and within 25 points of a record.
Tuesday’s gain lifted the benchmark gauge for U.S. equity to 2,068.59, moving it above the 2,063 level that marked the top of advances on Feb. 5, Jan. 22 and Jan. 8. Staying above it may lure back buyers who sold when the shares retreated in January, said Robert Pavlik of Boston Private Wealth.
“People are thinking that with the market close to an all-time high, they don’t want to be left behind,” Pavlik, who helps oversee $9 billion as chief investment strategist at Boston Private Wealth in New York, said in a phone interview. “If we have something like another 1 percent increase tomorrow, people will talk themselves into economic data and earnings.”
The S&P 500 declined 3.1 percent last month as analysts lowered forecasts for corporate profits. Estimates for first-quarter earnings slipped more than 6 percentage points over three months, the biggest decrease in six years, as oil’s plunge triggered revisions for energy companies.
About two-thirds of the S&P 500 companies have reported results, with 78 percent beating profit estimates and 56 percent topping sales, data compiled by Bloomberg show.
U.S. stocks have traded for the last two months in one of the tightest ranges since 2007, marked by a record high of 2,090.57 and Dec. 16 low of 1,972.74. Even as swings in the index become more violent, the gauge has failed to break out, rising above then falling below its 50-day average four times since December.
Daily Swings
The S&P’s closing price on Tuesday, the highest in 2015, was 3.8 percent above its lowest one, the smallest spread at this point in a year since 2007, when the high was 2.9 percent above its low. That’s happened even as daily swings widened, with an average 0.9 percent move the biggest year-to-date since 2010.
Advances in companies from Coca-Cola Co. to General Motors Co. helped the S&P 500 erase losses for 2015 Tuesday. The gauge climbed 1.1 percent to the highest level since Dec. 30. The Dow Jones Industrial Average added 139.55 points, or 0.8 percent, to 17,868.76.
“There’s no question that today was a positive move but we really have to get above the December highs to confirm a breakout,” Matt Maley, a equity strategist at Miller Tabak & Co LLC in Newton, Massachusetts, said by phone. “It’s been very frustrating for long-term investors looking for trends especially in the beginning of the year, because they can’t get a handle on which way things are going to break.”
Fizzled Out
Since the start of the year, three separate advances in the benchmark gauge for American equity have fizzled out just above 2,060, data compiled by Bloomberg show. The index’s all-time record of 2,090.57 was reached Dec. 29.
The Chicago Board Options Exchange Volatility Index surged 44 percent in December as investors weighed strength in the U.S. economy and central bank support for global growth against the impact of lower commodity prices and Europe’s ability to fight low inflation. The gauge known as the VIX has fallen 10 percent this year.
“It’s nice to see us break out a bit but who knows if this is going to start the trend for the next high,” Frank Ingarra, head trader at Greenwich, Connecticut-based NorthCoast Asset Management LLC, said by phone. “People are a little freaked out over what’s going on in Europe and Greece and until we get clarity or see something fundamentally different, our indicators aren’t saying whether we’re totally breaking out or not.” [Ref]
FTSE Outlook
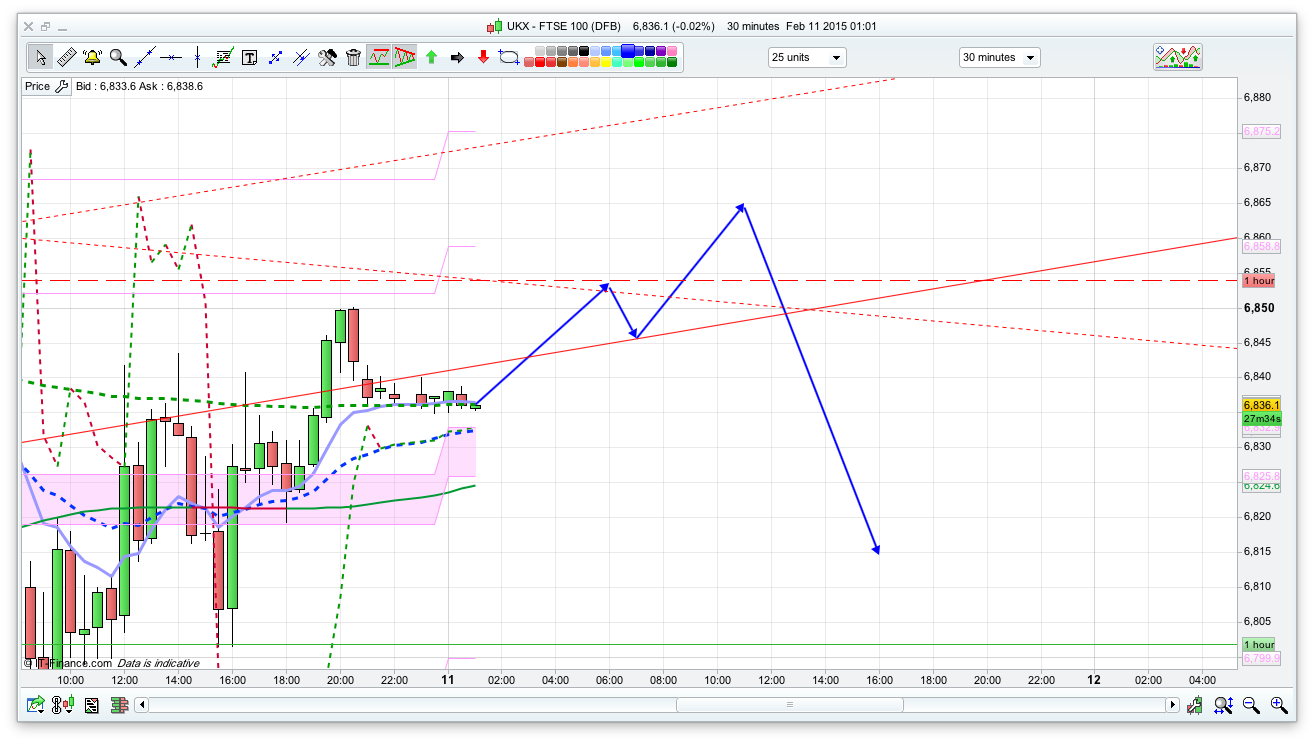
Initial resistance is at Tuesdays high around 6850, with the daily pivot above that at 6868, at that point I think the bears will have a go but a lot of what happens is going to be driven by rumours and guesses about the EU and Greece. While that uncertainty exists the market is going to be jittery. Above the pivot then the top of the 10 day Bianca at 6924 looks a good shorting spot – especially as we would then have had a rise from the bottom of the channel on Tuesday. Support is at 6815 today, with 6792 below that being the bottom of the 10 day Raff again – and a bounce here is quite likely.
I have plotted a slightly optimistic open with a break of the 6850 level to test the daily pivot at 6867 then a dip back to 6815. Below this then a long off the Bianca 10 day at 6792 is probably worth a go.
Feels like we’re just trading sideways atm in line with crude uncertainty. Very difficult to trade well.
It’s like Groundhog Day, I just keep selling at 6840 and taking 20-40 points. It will end when it ends, but I like ranging markets.
Looks weak this visit to 6800 but it has done before. Maybe try a little long at Nick’s 92 level.
Aga, 6792 here and it breaks. I think it might be testing the previous 6786. I wonder if anyone fancies a long, 13.30 soon…
I don’t know what to trade today, short or long. No idea.
Why today no movement? I don’t understand what’s going on. Took a trade from pivot 17829 short out with 10pips. on higher frames it shows supports for longs, possible. I don’t know what to trade short or long, please help!!!
I am packing in for today again. Argh..
It is a bit like watching paint dry, isn’t it Jack?
I have that 92 long with a break even stop on it, but I’ll close it anyway if it reaches the close @ 16.30 because I want to be out of the market when that Greece/ECB meeting gets press released @17.00.
I have a feeling it will be bearish although might spike prices temporarily.
Yep. It gives lots of false signals. but now I see that short from pivot 17829 could have given more pips if I wasn’t distracted for the phone call. People seem to call me every day at the same time. I couldn’t concentrate.
What was news out made this bounce?
Senu think it was a earning report from america…
Now again bounce, whats happening ..
All to do first, Ukraine deal, then rumours’ of Greece deal, then no deal…currently the markets are not tradable – Avoid!
However only for highest risk people.
That would be me then, that 6793 long worked well Wednesday!
No uckaine deal… Putin has gone too far and had to many sanction to back down,he at that meeting for lip service only. Greece no deal there miles apart could not even agree on a joint statement and this Greek government has a big backing of the Greek people. Now america have a bill on IS to vote on, this is a game changer a yes vote means more chance of foot troops going in… And what keeping the markets at these levels? QE. 2015 going to be a volitile year… When markets come complacent and media say bye now stock are still cheap there always a black swan round the corner, I believe this will come and flush the markets before the new European QE starts.