
Good morning. Well that was a bit of a sell off yesterday, with the US erasing all the 2015 gains! Pretty much every support got busted, with the only one holding so far being the 200ema on that daily chart at 6699. With the bottom of the 10 day Bianca reset to 6715 for today will we see a bit of a bounce? The daily RSI is also on 30, so around oversold conditions (not an indicator that I use in itself). If we bounce today then I wouldn’t be surprised if if we climb all the way to 6850. Its all boiling down to the uncertainty over rates with everything now expecting rate rises sooner rather than later. If the US raises there then the UK is sure to follow quite soon behind. Though I doubt they will before the election now. Personally I think we are still far from a safe economy that can stand on its own 2 feet, and not just the UK but certainly the Eurozone. It would be a shame if US rate rises stalled the early stage of the recovery there and plunged the world back into recession, especially as China is still on the ropes having just cut their interest rates again.
US & Asia Overnight from Bloomberg
(Bloomberg) — Asian stocks fell, following a slump in U.S. equities, after the dollar gained amid speculation the Federal Reserve is moving closer to raising interest rates.
The MSCI Asia Pacific Index retreated 0.4 percent to 142.17 as of 9:02 a.m. in Tokyo, with materials companies leading declines as all 10 industry groups fell. The Standard & Poor’s 500 Index slipped 1.7 percent on Tuesday, the biggest drop in two months, as the dollar surged to near a 12-year high versus the euro. China releases data from retail sales to factory output today.
“Rates are moving soon,” said Evan Lucas, Melbourne-based market strategist at IG Ltd., a provider of trading services in equities, currencies and commodities. “The jobs report on Friday has awoken the currency markets to this fact and the equity market is now feeling the early effects of what to come.”
Federal Reserve Bank of Dallas President Richard Fisher said the central bank should begin to raise rates as the labor market improves. While policy makers from Sydney to Frankfurt are moving toward looser monetary policy, the Fed stands out in accepting a higher exchange rate as a sign of economic strength.
Friday’s jobs report showed U.S. employers added 295,000 workers last month, beating the median prediction in a Bloomberg survey of economists, while the jobless rate fell to the lowest in almost seven years, to within the range the Fed considers full employment.
Regional Markets
Japan’s Topix index dropped 0.5 percent, heading for a third straight day of losses since the U.S. employment report. South Korea’s Kospi index retreated 0.7 percent. New Zealand’s NZX 50 Index declined 0.5 percent.
Australia’s S&P/ASX 200 Index fell 1.1 percent. Reserve Bank of Australia Assistant Governor Christopher Kent said the nation’s currency is still “relatively high” given the economy’s state even after the recent lowering of the exchange rate. He spoke in Hobart on Wednesday.
The economic data from China come a day after producer prices fell 4.8 percent in February, extending a record run of declines to 36 months. While consumer prices beat estimates with a 1.4 percent rise, it may be too early to conclude deflation risks have abated because last month’s Lunar New Year holiday festivities boosted costs. The central bank cut interest rates for the second time in three months from March 1, after earlier reducing banks’ reserve requirements.
China’s “fixed-asset investment, industrial production and retail sales are all expected to slide,” said IG’s Lucas. “If the U.S. markets finally exit the six-year bull market and China does indeed slow faster than expected, Asian markets are in for a rude shock.” [Ref]
FTSE Outlook
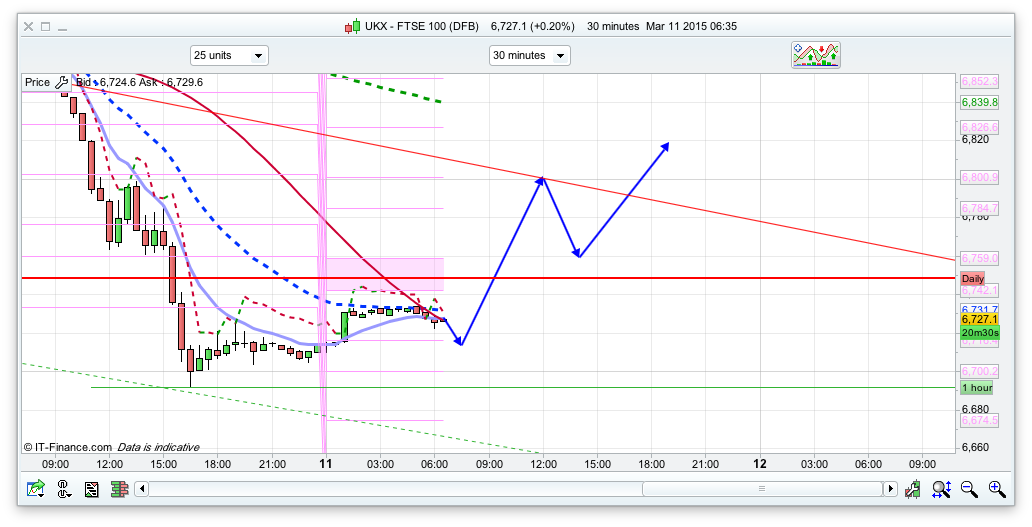
I have a feeling that we may see a bounce today. The bottom of the 10 day Bianca is at 6715 and we have held well since testing 6699 (the 200ema on the daily chart). The 30 minuet chart EMAs haven’t yet crossed over to bullish but they are quite close and the bottom of the 20 day Raff for today is at 6690. Not sure we will dip that low, but I am going for a rise this morning. The S&P is at the bottom of its Raff channels, whilst the Dax is actually still pretty bouyant (probably helped by all that QE money pouring in currently) at 11550 and shrugged off its drop to 11400 yesterday. The 2 main supports I have at 6715 and 6690, with 6670 below that and a point where it is likely to bounce – I haven’t put that in the trade plan but might be worth a go if it were to drop that low. On the upside, todays pivot is 6761 so initial resistance there, 6800 the top of that 30min channel next. If this breaks then a trip all the way to 6858 (25ema on daily) and 6950 isn’t beyond the realms of possibility and will just go to show what an over reactionary, rubbish drop this has been! However, the daily EMAs have crossed over to a bearish scenario, so the bulls might have a hard job breaking through the 25ema on the first couple of attempts (good shorting spot if it touches the 25ema, 6858 today).
Morning.
Not wanting to flog a dead horse, but I was reviewing yesterday and trying to understand why I just watched a 100 point drop and didn’t cotton on, despite seeing supposed support levels broken one after another.
I only started making a bit of money after the bounce from 6760, so not complaining. I know my system is counter trend based which is its weakness, but I still allow myself to trade outside of its parameters on discretion.
Looking at yesterday’s comments, apart from those who were short already (well played) it doesn’t seem like many of us rode much of that 180 point move.
Why do you think that is?
Hi tmpf
Probably like many traders – I got Hedged / Stopped out 3 x yesterday.
Why do you think that is?
I think it’s because there are different ways to “action” trades.
If you’d been using Trend lines on the FTSE Daily – the call was made March 3 when it popped it’s price below the Trend Line – to recover above it. Then on March 6 (Last Friday) it closed below it. It then took out the previous lows.
Trend Line Support is currently 6606. (It’s not without it’s risks – there is the possibility that this may re test the highs)
IF you’re using the 5 Min Chart – as you point out – if you’re trading Counter Trend systems it would have put you in several trades.
If you’re using a TREND Based system – 30 MA (5 Min) or 8EMA (5min) and used the “direction of the average” to help assist the Trade direction you would have probably been Short all the way down.
Also – hence why I was hedged out 3 x – I find looking for patterns – of Higher Hi’s and Higher Lows – or – Lower Lows and Lower Hi’s helpful. Yesterday – there was only one time (12:25 – 1:50pm) – the FTSE actually managed an uptrend. The rest of the time it continued to Break previous Lows (Ranges).
What’s your take on your own question ??
It always happens because people ambitious and share their views on 2 directions. Some people say long, some people say short, and you do nothing. Plus it’s the fear that if you actually now will go short it will be too late. Fear, nothing else. Because people are made strangely, when the money are literally pouring in your pockets we refuse to take it, but when they are earned or won hard way, this is the right way to do. We don’t like easy ways.
Tmpf –
Just reading your post again …
“I only started making a bit of money after the bounce from 6760”
I’m assuming the 100 point fall was the only thing that was the motivation for this trade ! I can’t see anything else ?
Hi Hugh
Thanks for your response.
I think we each use trading strategies which we perceive to be logical and which suit us psychologically and practically. Mine is a high frequency short term rsi based approach which is consistently profitable in ranging markets but on days like yesterday just stays glued to the extreme (a sign in itself in some ways).
It came into play once that 6760/6800 range gave it something to work with and I made 38 pts all told, but I remember covering a short from 80 at 64 on the third test, even briefly going long, and then sidelining myself for the next 60 points. With hindsight a short once 60 broke was obvious, but I didn’t do it. Never mind indicators etc. that sucker was only going one way.
My question doesn’t really have an answer I suppose, just interested in your and other people’s thoughts on the matter. 180 pt opportunities don’t come along very often.
On days like yesterday, technical analysis often goes out the window, due to panic selling, etc. I`m guessing many didn`t keep the short due to the fact that for the past 5 weeks buy the dip was 100% the way to go, but make 10 successful trades doing that and being caught out yesterday is no big deal as long as you had your stops. Short term EMAS worked a treat yesterday as they do on trending days.
tmfp
I like the RSI system – one thing I have noticed.
IG charts – Run 24 Hrs (default)- there is the option to change this to run 7am – 9pm
Saxo Charts – Run 7am to 9 pm
The different parameters will give slightly different RSI readings.
** Think this may only apply to 14 periods – e.g. mornings at the open.**
Thanks Hugh, I didn’t know that about IG charts, looking at how to filter out that night time noise now. I have been using these http://www.investing.com/indices/uk-100-chart for market time only data.
I also trial some of their weird and wonderful indicators along side my favourites, but then you run into cause/correlation problem.
Dax nearly 200 points up today time too add to short
DAX and FTSE travelling North and South
Short @ 11706
Dow 5 mins. — SMA 20 just peaked, index about to cross below SMA 100 — more panic attacks?
FTSE — 6700 going . . . . . .
like Boeing…
what next Jim?
Let’s see if it manages to clear 6700, or not! ROC struggling.
Nick wants up, Jim wants down. Where is it going?
going nowhere 😀
exactly. more likely to push up.
Guys, anybody know if IG or ProRealTime provide/support Logarithmic Charts ?
Sam
Click on the Spanner Top Left hand side
Click on price
On the right hand side
SCALE TYPE > Choice of Linear > Logarithm Scale > %
thanks a lot hugh
Looking rather weak?
Are we about to see another sell off?
yes, i think. except DAX, also FTSE divi today
Don’t think the divi will even bring the buyers out now…
Thought divi was tomorrow?
http://www.reuters.com/article/2015/03/09/markets-britain-stocks-exdiv-idUSL5N0WB1H220150309
IG apply at 16:30 on their platform, on Wednesday
What you guys predict for rest of the week?
FTSE assault on daily EMA200 come on baby you can do it 😀
still holding sam
gutted 🙁
long DOW 17670….hedge if you like 🙂
that’s a good entry
dow bounced from yesterday’s low.
yes, could bounce to pivot. RSI 30.9 held in 30min chart next level to break up 17740 before pivot. Lets see.
sam, where do you have stop?
b/e….looks like i might be stopped 🙁
well, bounced off 🙂
Jim, any views on dow today?
Hello Guys ,
This is Abee, New here but been reading Nick,s posts for a while now. Any suggestion on FTSE going back to 6800+,
Thanks
Hi, Welcome. Will depend on the US S&P, if that holds above 2041 then yes, quite possibly; if not then 6600 and lower is likely.
That DOW is so coming down to 17550 today.
750 first 😉
Yup, trying to break RSI 50 in 30min already broke in 10min 🙂
closed dow for 50 points
Long @ 94 playing well
FTSE breaking ?
Dax short closed 11775 was not expecting such a big push today… Will not trade dax now moving back to Ftse and ASX200 with QE from Europe can see the dax hitting 14000 this year but is far to risky too long…
DAX wow train without brakes!!!
incredible 😀
Senu — Dow 4 hrs. ROC is recovering a little, but still negative. There’s a fair chance that the ROC will peak while still negative, in which case another sharp fall will likely follow.
Thanks mate. scared to take any position 🙁
ROCnRoll indicator [5 mins.] is short this bar and last. But extremely choppy. 🙂
Yes Darren suprised really as the greece problem still there… Can only think that it’s big hedge funds buying due too euro crashing
divi hunters pushing ftse up?
Short dax 818……brave i think but got to have a little retrave from here surely
Got stopped -20
FTSE push to 6,760?
hopefully yes… i mean No. but Yes. !”£$£$$%%£$%$ this is what happening since morning 🙁 I took long @ 700, still holding for pivot
I mean dow @ 700
DOW false break out of range?
Where you in again?
yes i was in but as always DOW stopped me before dropping further 🙁
Got 20 open positions all long, made a mistake. Any suggestions 🙁
DAX 12000 tomorrow….?
If dow falls at close, then Dax tomorrow possible. Don’t ask me logic. 🙂
Looking like the dow is wanting to drop at close….
As long as the euro keeps getting smashed at the current rate. We could see parity to dollar in days and the dax well above 12000
smokingaces, now you know what I meant about when I said 1 single trade may take the whole your account. (I hope it didn’t, but it might). So a stop for any trade should be. If you had stopped at 11400 or even 11500, you could have still saved 350 points lost on top. It’s a big chunk. There’s nothing wrong with Dax and there’s no point of stopping trading it. It’s you who didn’t stop assuming IT HAS TO GO DOWN, IT HAS ALWAYS GONE DOWN, IT’S TOO HIGH IT HAS TO GO DOWN. It doesn’t work like that.
I hope you now learnt that it’s possible to lose lots of money like I did last year when Dow was going up and up in a similar fashion. It’s all possible. It’s really sad, I know what you feel right now. It’s hard.
Trend is making new highs and doesn’t care about left supports. To break down support is very and very hard.
sorry, you closed 11775. But still 275 points on top.