
FTSE 100 live outlook prediction analysis for 16th January 2020
Wall Street hit record highs as Donald Trump signed a phase one trade deal with China. The Dow Jones, S&P 500 and tech-heavy Nasdaq all rallied on the back of the news. The US President said that tariffs will remain in place on hundreds of billions of goods until ‘phase two’ completed.
Movements on the FTSE 100 were constrained, with the blue-chip index spending much of the day flat. It ended the day narrowly up, with about half its constituents registering gains, as positive sentiment on global trade mingled with further tough talk from Number 10 over looming trade talks with the European Union.
President Donald Trump has ended two years of tit-for-tat trade battles with China, with a partial agreement to resolve some areas of conflict. “Today, we take a momentous step, one that’s never taken before with China,” that will ensure “fair and reciprocal trade,” Trump said. “Together, we are righting the wrongs of the past.” Tariffs will remain in place on hundreds of billions of two-way trade until ‘phase two’ completed.
Finally!
It’s been three years in the making, but it looks like the phase-one trade deal has finally come to fruition. The U.S. and China signed what they’re billing as the first phase of a broader trade pact on Wednesday amid persistent questions over whether President Donald Trump’s efforts to rewrite the economic relationship with Beijing will ever go any further. The deal commits China to do more to crack down on the theft of American technology and corporate secrets by its companies and state entities, while outlining a $200 billion spending spree to try to close its trade imbalance with the U.S. It also binds Beijing to avoiding currency manipulation and includes an enforcement system to ensure promises are kept. The ceremony at the White House was a rare moment of friendship between the world’s two largest economies after almost acrimonious talks. The benchmark S&P 500 Index set an intraday record high for the sixth consecutive trading session.
Market Moves
Stocks in Asia looked set for modest gains as investors parsed details of the U.S.-China deal. U.S. equities eked out new all-time highs and Treasuries rose, while futures nudged higher in Japan, Hong Kong and Australia. The S&P 500 Index climbed as investors took solace from that easing of tensions between the world’s two largest economies, though ended the session off its high. Soybeans slumped after China signaled purchases would be demand based. The dollar dipped and Treasury yields retreated. Meanwhile, Russia’s ruble weakened after President Vladimir Putin announced changes to his government. Oil drifted, with West Texas Intermediate crude trading around $58 a barrel, and gold nudged higher.
FTSE 100 Outlook | Trading Signals | Forecast | Prediction | Analysis
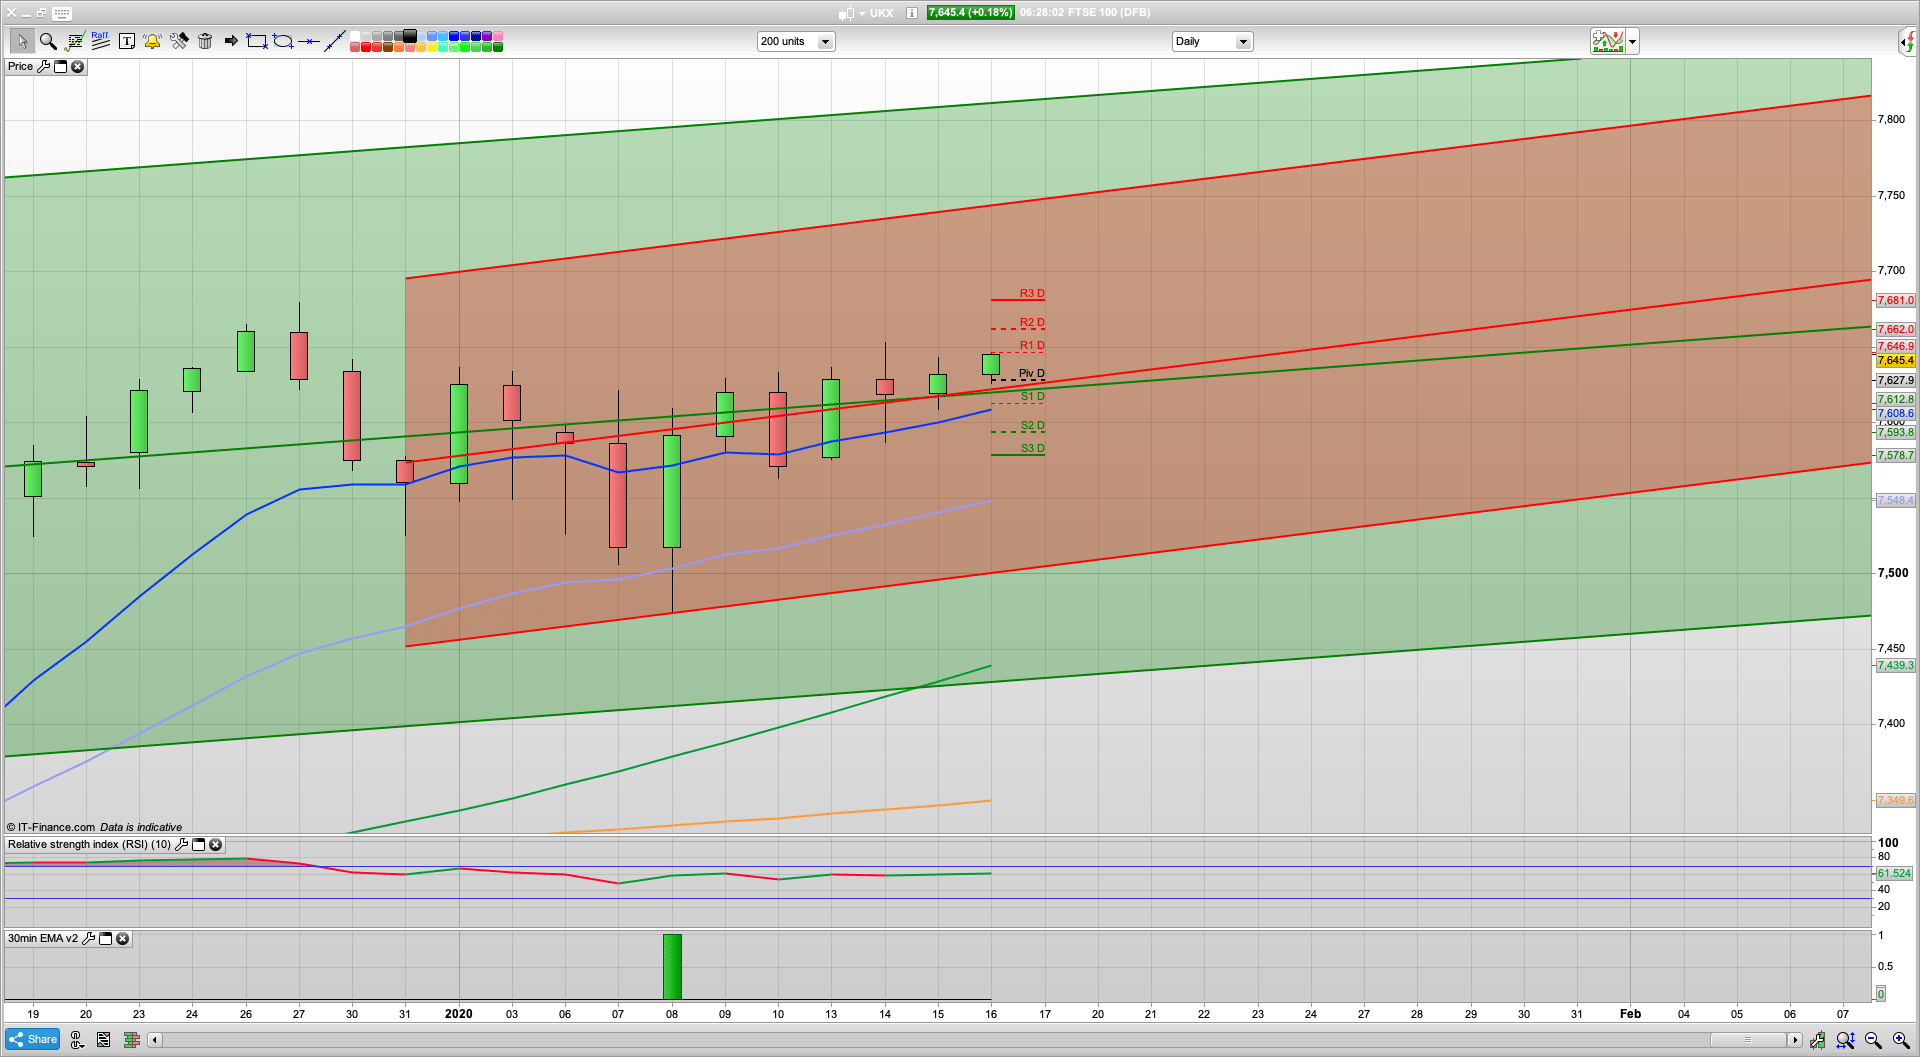
That’s that then, the deal is signed, well the first part anyway. 3 years of will they won’t they finally moving forward. A lot of it has of course been priced in with the rally that never ends, but that said I am thinking that we may well continue to move higher in the short term. The bears haven’t exactly piled in at the 3300 level on the S&P, though we have of course only got to 3299 so far. Will we see some further upside today and break through that round number? Looking at the FTSE 100, there is still potential for a rise to 7662 and possibly 7680 and with R3 and the fib at this higher level I think that a rise to here then a bit of a drop down with some profit taking later could well play out well.
The 2 hour chart is bullish once again, the bears failed o get it below 7600 with any conviction and with the daily pivot at 7627 for today we may well see a bounce off this level, if we get an opening drop.
The bulls will be keen to break above the 7640 level which has capped the rises so far in January, and should they do so then we should see 7680. May 2018 saw the 7900 level, so will we see a double top with this a couple of years (roughly) later? I have often mooted 8000 as a level likely to be seen at some point soon and maybe that will be this year.
Anyway, back to today. I want the bulls to defend the 7627 level for a rise, but a break of this will likely lead that that 7580 level and recent support. Should the bears break below that then 7500 beckons where we have the bottom of the 10 day Raff channel. However, I am preferring a long off the pivot for a rise to test the 7662 and 7680 levels. The latter is of course also the double top level with the December high. Should the bulls break higher, then 7744 is the top of the 10 day Raff channel and a level to look out for/try a short off/trade long to target.
The US might well be relived that the deal is signed and spring up a bit higher during Thursday’s session.
Recommended Broker
IC Markets – offers market leading pricing and trading conditions by providing clients with True ECN Connectivity; this allows you to trade on institutional grade liquidity from the world’s leading investment banks, hedge funds and dark pool liquidity execution venues. Highly recommended!
Membership and Live Trading
If you would like more detailed analysis for FTSE 100, DAX, Gold and S&P, including the trades that I am looking to take myself, then please join my active members community.
What you get
- Daily Analysis pre market open (sent around 7am each day) for FTSE, DAX, Gold and S&P.
- Daily email pre market includes my trading plan for the day including ORDER levels, with stops and targets/limits
- Telegram live trading room and webinar group membership for discussion and realtime trade updates
Keep up to date with new content, free sign up below
[yikes-mailchimp form=”4″]