
Good morning. Well the long worked out ok in the end but it was fairly hard going, I held it open over the close to collect the dividend (a useful 11 points yesterday), but with prices then dipping back closed it at 6700. There wasn’t even that much buying from the divi hunters at the close yesterday. Overnight we have dipped below the 20 day Bianca channel for today at 6689 and have bounced up off the 10 day so far at 6676. Inflation data out yesterday came in at 2.2% for October, below the forecasted 2.5% and the lowest level for more than a year. Generally the UK is enjoying some decent data at the moment with UK growth “firming” according to the OECD. I take it all with a pinch of salt though, as these forecasters are the same ones who said that austerity in Britain was strangling it earlier this year and that the government needed to change their policies. They didn’t and now the data is improving with the UK likely to be the fastest growing G7 economy. So all good then? When the media are all uber bullish time to be a little cautious, though with the price hitting the bottom of the 10 day channel and bouncing a little there is still the possibility of a 6746 test (top of the 10 day channel).
Asia Overnight from Bloomberg
Asian stocks fell after China’s leaders failed to outline steps to curb state dominance of the economy and amid bets the Federal Reserve may start reducing U.S. stimulus next month.
Banks slumped in Hong Kong after a communique at the end of China’s four-day plenum made scant mention of financial reforms. Tencent Holdings Ltd., China’s biggest Internet company, fell 2.5 percent after a news report quoted its chairman saying the company’s valuation is “scarily” high. Noble Group Ltd. lost 5.1 percent in Singapore after Asia’s largest commodity trader by sales said profit slumped. Pioneer Corp. surged 21 percent after the Japanese maker of car stereos reported an unexpected first-half operating profit.
The MSCI Asia Pacific Index dropped 0.9 percent to 138.59 as of 1:53 p.m. in Tokyo, heading for its first decline in three days. All 10 industry groups on the measure fell.
“Quite a few people put on their positions ahead of the communique, expecting actionable moves to be made, but that’s not the case,” said Andrew Sullivan, director of sales trading at Kim Eng Securities in Hong Kong. “The market is just disappointed.”
S&P
Futures on the S&P 500 lost 0.4 percent today. The measure fell 0.2 percent yesterday as corporate earnings and an improving economy fueled speculation about the Fed’s timetable for reducing stimulus.
Fed Bank of Atlanta President Dennis Lockhart said yesterday a reduction in U.S. bond purchases “could very well take place” next month.
“Tapering is obviously back on the agenda as data in the U.S. continues to be strong,” said Donald Williams, Sydney-based chief investment officer at Platypus Asset Management Ltd., which oversees about A$1.6 billion ($1.5 billion). “Maybe that’s enough for a small correction, but I think with rates at very low levels and likely to remain low, it’s still a good environment for equity markets.”
Fed’s Outlook
Investors will scrutinize U.S. economic reports this week on jobless-benefit claims and manufacturing in the New York area. Economists forecast the central bank will delay tapering asset purchases until its March meeting. Policy makers will probably pare the monthly pace of bond buying to $70 billion from $85 billion at that time, according to the median of 32 estimates in a Bloomberg survey on Nov. 8. The Fed next meets Dec. 17-18.
FTSE Outlook
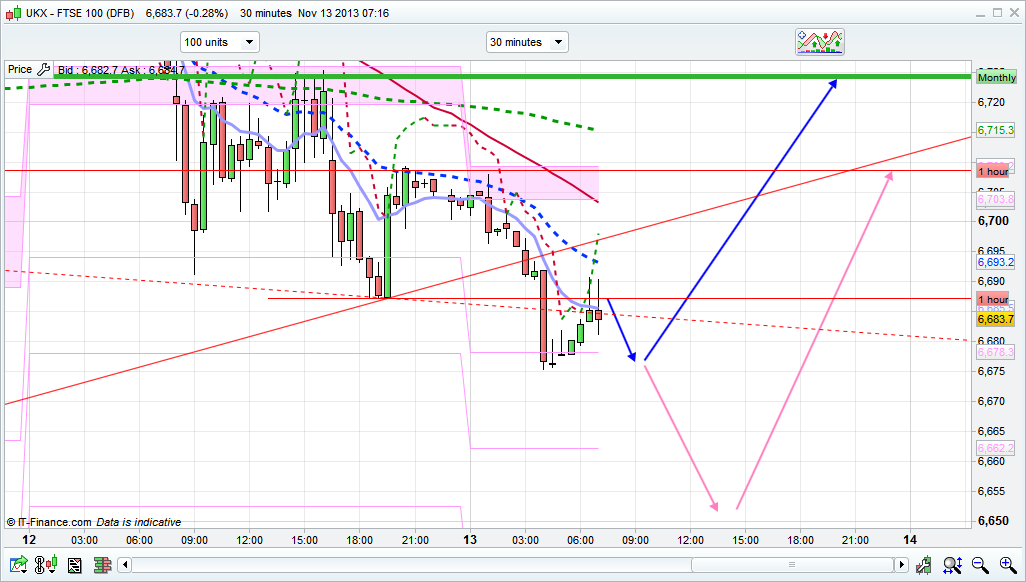
The 10 day Bianca channel bottom at 6676 has held overnight, and there is still a possibility that the bulls have a bit of a charge left in them to test that 6759 area mentioned a few times. If the bottom of the 10 day channel holds then we could quite easily get a full channel crossing today/tomorrow to hit the 6746/59 area. Support is 6650 today so watching that level closely if the 10 day channel does break as weakness targets 6610 and 6572 after that. As I mentioned above the media are being exceptionally bullish, always a bit of a worry when they are talking everything up. With the Dax looking like a dip to the 9015 area, the FTSE might test the 6676 again pre market. in fact its just dipped 5 points while I write this to 6681. Either way sentiment is starting to swing to the bears I feel based on the weakness creeping in this week, so we are swinging back to looking to short the rallies and 6744 should be a good area if seen, being the top of the 10 day channel. I have plotted the blue arrows as my preferred plan for today which is the long off the bottom of the 10 day channel, however, the pink arrows show the bounce off the 6650 level area if that Bianca channel breaks.
Nick, looking at where the FTSE is now 6740 could align up with DOW @ 16000 ?
Yes it could do, you would think the US would want that number too
Still holding my short from 6777 hope that I will get my 6650 today :))
And You did 🙂
holding for 6640?
Long @ 6653
Yeah Bee, nice on I sold my short 6740 got my 6550
Cheers 🙂 90 pts 😮
Looking to close short from 6710 at 6640.
How low do SE everyone expect FTSE to go today?
I’m looking to get out, but if I can get 6600 I’ll hold on
Can I ask – in your post, where does the support level of 6650 for the day come from? One of your indicators? I can’t see any line at that level on your FTSE image.
Cheers
Simon the support came from last week`s low
As simple as that? Thanks Ahwab
long at 6649,6 stop at b/e
Nikkei due to fall back to 14000 in the next few days I placed a small short on it this morning. Still above 14600 so may worth a try guys……
Taken profits at 6650 from 6710 🙂 happy with that
Yeah, nice one, looking to sell another high for 6600, before I start buying some dips..
Do you reckon ftse will hit 6600 sometime today?
Not really, unless DOW drops a lot, i think we will get sideways/slightly upwards movement for the day. Best to wait it out and see if there is a reasonable high.
Close mine at 6650. 60 points! 🙂
The 6650 level was a good shout.
Still not comfortable with buying here though.
Yes same, looking to short off 6700s. Will look to buy if we fall lower than 6600 for the medium term.
Me too, looking to buy below 6600 for Santa Rally 🙂
Held all three my shorts from 6720 and cashed out at 6650. Long at 6650 and will buy the dip at 6600. I think we might see it before Friday, but may start the Santa rally then…
Just hope the FTSE holds, but the market is quiet positive atm.
Fingers x’ed. GLA
Read my mind.
Went long @6650, looking to close at 6675, probably hit 6700 before another drop..
Tight stop?
No. only target 🙂
Nice one 🙂
Very doubtful, it will go any lower so early,should be a bit of relief rally.
ahwab may i ask you target for the DOW if u are still short at 740 ? Thanks
Ideally, 15600, will be where I take off 50%, then leave the rest to hit 15500, as DOW is in a very strong uptrend as opposed to the ftse which is bearish.
Long again
support from last week 6643
6625 level has lots of support. Could be buying level
got hit @6640 lol, that didn`t take long
Why Nick draws disorientated charts. If it’s supposed to go down the arrow should be down.
Jack, you`re too reliant. The best tactic is if Nick`s prediction aligns with your own, guarantee 8/10 times Nick will get you money, from reading his updates. But why not just subscribe to him lol, he gives updates on his trades..pretty sure he does very well for himself.
The problem is that I had short and once I saw Nicks chart I took long and now I am losing loads.
Jack, your chutzpah defies belief!
Dang it, closed too early lol…It`s that mentality that I just want to bank the money as all too often I had the money and then goes it b/e then negative lol.
Oh well better safe than sorry!
Could have always made more money in hindsight. I’m just happy we cashed in on our target. It could have been rising right now near 6700 easily. Always better safe than sorry
very true.
Long at 6630, tight stop at 6618, gl all.
Long 6644 and 6629… Target 6700 level ish
The problem is everyone is thinking the same and I am sure everyone buying at the moment is fueling the bears :/
Once everyone got their longs in we will see end of day relief rally with possible drop tomorrow and until Friday.
The only problem for me is the drops are coming at an alarming rate, not steady at all….
FTSE doubling the other markets. I reckon some bounce from these levels
I’m not feeling any longs right now until maybe 6600.
the trouble is we all knew it was going down piled on too much saw it make money b/e then lose and thought bugger this ill make some money and get out. Now we are trying to catch the fulling knife! never learn …
I think I will sell at b/e in a bounce. Let’s see how the open works…
Looks like I’ll get my 6610 after all
Don’t know where you got 6610. All I am interested will it actually go up and to which level would be nice to know.
I don’t think there will be bounce today. Do you still hold ur long?
I hold.
damn, 1.3 points out. Mentioned it in the post if 6650 went 6610 was likely
You were right 😀 that 6650 worked as you told.
But the lows of last week were 6643. And I cannot see any support at 6650 and only as a round number. Can you explain in detail ?
It was weekly S1 on the ProTrend charts
I don’t think it will be back to 6740 this week, it started dipping already. Nick charts are not working :P.
Nope, was a bit too optimistic today 🙁
Surely there has to be a reasonabke bounce on US open? FTSE is down almost 2%
yes, a small bounce and fall further
Good to see some of the longer term traders getting paid off. Those using 8 and 21 ema on the daily will have seen a cross over to the downside overnight. That made a solid argument to hold the shorts or enter in the 6700 6690 zone.
Sorry to see knife catching, doubling up and not setting stops still being posted.
Stops are my friend. They should be yours.
Trade safe
Still long stop at 6600…
Long @6620 stop 6610
Whats your target, ahwab? 6650 or 6700?
Nick, can you tell me if that 6650 you are talking about is a round number for the 6643 lows of last week ?
Still waiting for an answer. Thank you
Weekly S1. you can see it here http://td.md.it-finance.com/ProRealTime_V10/display_chartimage.phtml?name=9m1l86eq7mc6hvp6ay7rgz25v&type=png
6675
Do you expect it today, ahwab, or maybe tomorrow?
It’s gonna slide at leafy another 160 points
this is interesting snp bump looks more than the usual pomo. also ecb hints at more QE ..all the grizzlies still holding ?
Looking for 6750 now as an early exit, should get before close
6750 is a bit optimistic isn’t it??
Would like it, but don’t think that much. If we get 6700 we will be lucky imo
A what???? 6750???? what market are you trading? lol…
6750 before close …. Pah !
Shorted FTSE 6638 …. £150 pp
.. just following the same pattern as last November … all rise your honour for next week 🙂
But it’ll slide for next two days
Lol 150pp gl with that buddy if you are lucky the DOW won’t push the ftse up, look at that daily lol
lool 150 pp at this point in time. US nearly flat now
ahwab be greedy you may get 6675 ? 6680 ?
The only time I will see £150 p/p is on my trusty demo account!
good analysis like it too much i want ur gold and silver analysis where i found u
Thanks Asad I will place a running stop. Baffles me how people trade with 150 pp in a crazy market lol
anyone explains that 6650 that Nick is talking about ?
6750, Dave you -£1000+ yet?
guys I know not a ccy forum but dollar yen looking great on the chart about to break triangle consolidation on daily and weekly. plus look at price action today. Looks like someone may know something about GDP print tmw !
Just a thought
I had to save my skin, closed -7.5 points with total 22.3 points loss of usual stake. Upset cos it took me a whole week to get those 22.3 points in the first place.
I closed 6653 cos who knows if it goes to 6660 but it may drop to 6612 again. Didn’t want to give it a chance.
I made a huge mistake looking at Nick’s chart today and ignoring EMA. Annoyed a lot. I took long where I previously tried short and closed and took look as soon as I I saw the arrow. Dah.
Not sure how to play with game with Nick’s charts. Frustrated.
Lost 67 quid today, not the best day.
took long
anyone short the dow here at 710 ?
I missed the boat when DOW was at 740 to short. DOW is bit strong, made a nice recovery. Ahwab, what do you reckon? Good to short.
Well the bloody dax has bounced back again
We will see 15600 today
Closed long on ftse
Looks like 50% fib. Thanks by the way, you gave me strength to continue with my recovery.
Might get a retest, as S&P has touched its daily open, so should bring down the ftse
go dave !!
Ahwab, where would we be without you? A big thank you. 🙂
Nick, can you tell me if that 6650 you are talking about is a round number for the 6643 lows of last week?
lool…seems like most people had a good day- i thought id miss the bus going down and i had uni all day today-my short got triggered at 6694.5 but i only set the limit profit a 6675 :(( remind me to use trailing stops next time
ANYONE can you explain if that 6650 Nick is talking about is a round number for the 6643 lows of last week
Weekly S1, see here http://td.md.it-finance.com/ProRealTime_V10/display_chartimage.phtml?name=9m1l86eq7mc6hvp6ay7rgz25v&type=png
THanks. Its the IT Finance alghorithm. I never used it. I use my own formulas. But sometimes it works like my own 😀
nice one Dave, i’m with you short too and enjoying it 🙂
12 point ….. £1800
Well my lazy strategy paid off. Closed last weeks short from 6780 at 6630. 150 points Booyah!
Here we go again 😀
POMO day arriving ? 😀
The T-Line close below from Nov.6th doing it’s damage. Until a close above this FTSE is doomed. Small targets and out
And the slope keeps slopping even further to the downside
whats the call here guys with the u.s performance ? PMS still bearish ? Ahwab ? Senu ?
Lol……Nick says his prediction just missed his call of 6610. Am I the only one confused?
Nick’s preferred plan in blue was from 6675 to around the 6744 area, then short the rally. Failing that, the pink diagram plan was from the absolute support level of 6650 to 6710. Neither worked out by a long shot!
FTSE touched a low of about 6611……so neither the 10 bianca or 20 day bianca channels held at 6676 or 6689….Nick did say that if 6650 went then there is a possible target of 6610 and 6572. But the problem with this analysis is that it covers every angle, so if the market drops, the analysis is accurate and if it rises it is also accurate, i.e. it is not really accurate or helpful, but simply attempts to cover both possibilities in a vain attempt. Remember, Nick’s main theme today and for the last few days has been to reiterate the bullish theme-i.e. target 6746+ area, top of 10 day bianca channel.
Sorry if I sound harsh Nick, I know you try your best, but hedging it ‘both ways’ and saying the analysis was correct is not helpful. That then sort of puts you with the CNCBC lot….lol…just make your call, one way and stick with it, it will be more useful than the current approach adopted by you. Just constructive criticism to help you improve your forum, and help those following it.
I don’t trade indices much, more forex and equities and occasionally FTSE now, and I find that following religiously other people’s ideas on forums, twitter etc, is more of a hindrance, as there are too many cross channels at work, and these pollute your analysis and trading strategy as you are handicapped, at least subliminally, by other people’s trading ideas, usually just random number calling like in bingo. Since ignoring other people’s trading tips for some 2 months now, I have found that my head is more clear and I can make my own judgement call more accurately because there are no signposts in my head with people’s names corresponding to their call…i.e. short 6750 £10ppp etc….GLA!!
I couldn’t put it better myself!! Well done Ray 🙂
And he also said we will rally from 6650 or 6675 to 6710 and 6746 respectively (see diagrams), that is my point…hedging it both ways…you are covered both ways, the analysis is 100% accurate because you have covered both eventualities!
I do tend to agree Nick’s charts are generally a couple of zig-zags, which in general if your “blur” your eyes fits most days price action !
Well thanks for that! I see what your saying though. I do my analysis at 06:30. I had support at 6676 so went logn there, stopped at breakeven, had support at 6650, went long there, got stopped at 6640. After that i had support at 6610, didnt quite reach it, though went long at 6620 instead. The problem with trending days, just trade off each support and then possibly one will hold. None of the upper targets on the original trades were reached obviously. I have been saying for a few weeks though i expected a dip to 6600 before the Santa Rally kicked in. You just saw it.
I hope to come back in say 6 months and post up my profit/loss statement for the period…so hopefully end of April….that’s done it…tons of pressure now!!!
Have found that trading back to what I used to do when I first started is profitable for me. A bit like fishing…patience…and hunting out 1 or 2 good trades a day in equities primarily, a little forex/indices.
No dow!! Had enough of the huge range potential. Only got into FTSE this morning because I saw it down some 100 otherwise was watching to go long Barclays for 10p in next few days. Range for year just £2.45-£3.30 approx…so better odds if you lose your trade, because in this narrow range you can average down and still make money. Try that with FTSE, 6000 to 6900…900 points to average down if it goes against you…it did in May, in just 3 weeks!!
Indeed, talking of Barc, have 240 and 220 as possible buy levels
Spot on with Barc though Nick 🙂
TOTALLY AGREE WITH YOU. You just read my mind.
What’s the point taking trades from supports, why not encourage people to enter the current short trend instead?
Thanks Jack, I was scared everyone was going to ostracize me for my opinion…oh well…:-)
Look at the Dow climbing, maybe we had our dip and would start end of year rally?
Have my long still going, so let’s see what happens…
Sorry if I sound harsh, but I have become battle hardened! Lol…
Arent we all. and cynical
Take todays news for example – all great positive stuff, FTSE drops out of its arse. Pity the poor fools reading the news headlines and stories and thinking oh thats good news, i think i might dip back into some shares as companies should start to do well.
But Nick said if it broke 6650 will go deep. He was right on that.
And he also said we would rally from 6650 or 6675 to 6710 and 6746 respectively (see diagram). That is precisely my point, hedging the prediction/analysis both ways, thus the analysis is 100% accurate because you have covered both eventualities! Which anyone can do….
But you do trades, based in others people analysis ? Huge mistake.
It only serves as reference, nothing more
I never trade on other people’s analysis, just use as reference only, but find that subliminally your mind processes other people’s calls, irrespective of your attempt to be objective and to discard them !
That’s what I mean by cross currents, half pulling you one way, the other half the other way, and a few just attempting to piggy back on the coattails of a few!
For example your constant call of the 6840 area was amusing together with the then complete volte- face and calling for the 6600 area then back to the 6800 area….lol…
All i do is say my support and resistance levels, if they hold then i give the targets. if they dont hold then forget the targets.
Nick’s not stupid though he’s making a nice £30 from every member, so if he has 100 members, that’s a cool £3k a month with no risk! beats my trading performance any month 🙂
😉 😉 Spot on Al !!
Except that I do have to deliver? That 100 would soon disappear with a few shit calls and no help! Its still stressful putting your neck on the line saying what you think its going to do…. almost worse than the actual trades themselves
No hard feelings Nick, I still respect you for putting out your daily call, it’s not easy as you know, you do your best, that’s all that matters my friend 😉
But, even if you are wrong, that is fine, it’s markets, they are volatile some days more than other days-jumping around like Kangaroos on steriods-but, it is better to stick with 1 call and 1 direction as hedging it both ways confuses the whole analysis that you post.
Also, your task is even more difficult regards non-subscribers, because you make your call before US data comes out in the afternoon and more often than not it is used as a ‘pretext’ to move the market in a particular direction, with no correlation to the actual data. Example, last week, GDP/US on Thurs, better than expected…interpreted as ‘good news is bad’ news..sell off…next day…good NFP….interpreted as ‘good news is good news’ …rally….instead of the rational ‘good news is bad news’ and a sell off….CNCB said good news is good news…but omitted to mention Fed POMO of $5bn!!
Look at those idiots over the pond!!they think its buying opportunity at those levels!!..lol…they are creating bust bigger then we can imagine!
Adam’s obviously taking the same medicine as me…as bloody cynical as ever!!! 🙂 Good on you ….;-)
Good day today, I think we will see sustained bullish albeit a slow one/sideways movement until tomorrows open. Should be interesting…not really a time to commit to a trade of any direction as DOW looks so strong. Looking for 6575 for another sell point. P.S. It touched 6750, for those who were so insistent we wouldn`t get there we did, eh Adam?
6575 ? 6750 ? 😀 Can you clear this numbers ?
ahh, sorry 6650..long day. looking for 6675 as another sell point.
We are definitely getting a rise in the morning, 6675-6700 as a target, with the bs that the DOW is pulling
Heads up everyone…DON’T SHORT on 21 NOV….FED POMO …big one…..2nd biggest of month…$4.25-$5.25 bn….you will be fighting Ben Bernanke who will conduct Fed POMO-permanent open market operations…via Federal Reserve Bank of New York….on Friday just gone, NFP day, dow rally was NOT because of good news is good news, but because we had a BIG POMO…$5bn…Fed (Ben Bernanke) conducted POMO between 10.15-11am (3.15pm/4pm GMT). Same time every month.
Don’t let anyone fool you otherwise, especially CNBC, the day before it was good news is bad news regards fed tapering re US GDP coming in better than expected!!
This calendar is published every month….google…newyorkfed.org…..or type in google FED POMO SCHEDULE…usually 2/3 big $5bn pcm…anticipate this move a day or two before or on the actual day….fed basically providing tons of liquidity for all the proprietary desks at investment banks/hedge funds then to buy asset classes…just one primarily..EQUITIES!! If I hear another person say valuations are cheap regards stocks I am going to shoot myself!! lol..Ron Baron on CNCB last week…
Cheers, will research into that, see if I can add anything to it.
I mentioned this last week Here is the link
http://www.newyorkfed.org/markets/tot_operation_schedule.html
Never sell the dow ever again it is going to the moon! that’s because valuations are cheap, cheap cheap cheap compared to yesterday, 2007,2001,1999, 1986, 1929 …. my bet it will close at 15825. 😉 No santa rally he is drunk on too much FED cash!
oh too prove a point Ray in 2013 87% of POMO days (which is today by the way but only a small 1 yard) market was up ….
Thanks Dom….never realised you had also found out about the POMO scam days!! Sorry, don’t read the posts much now, only when I (rarely) trade the FTSE. Today being one of those days because it was down some 100!! Anyway, closed my FTSE, so back to a fresh hand with equities/forex tmrw. You are bang on about the positive correlation, I think I read it in Zerohedge.
Just a wild guess, headline 16000 on dow may be hit by Xmas just to get the small retail guys in (not me), then it’s pump and dump in the new year. 😉
Ray no worries, if you trade FX have a look at http://www.global-view.com they are good for fx its a forum plus gold. I read them all the time have done for years. Good bunch of guys on there. good luck
Thanks Dom mate, appreciate it. 😉
as for 16000 and jan my sentiments exactly don’t forget we have the debt ceiling limit shenanigans again in jan and of course tapering will she … will she not plus the come down from whats going on now.
If someone don’t like Nick’s post then don’t read them. Personally I am grateful to him and everybody else for sharing their opinions here. To the critics:come up with something better or “jog on”!!!
That Ray is amusing. I sense he has been loosing a lot of money with other+s people analysis 😀 😀
I think you mean ‘losing’… 😉
I have jogged on..literally…:-) As I mentioned, it keeps the trading head clear, well for me anyway. Regards constructive criticism, there is nothing wrong with that, in fact, if you read my criticism correctly you will find that it is perfectly valid. I challenge you to find it as being inaccurate ! In fact, I hope Nick takes it on board as it will help his site. I am not in the habit of pretending that all is kosher when sometimes it isn’t.
I agree. Maybe it wasnt clear but I was bullish for today from likely support as mentioned. My caveat was that if 6650 broke then we would likely see 6610. So, go long off the supports, if they dont hold, then thats why we have stops. If they do hold then ride them to the targets 🙂
Magnanimous as well! :-)….Nick you are truly a remarkable person! 😉 Why can’t the CNBC lot be like you when they get it wrong??
This strength move to the upside, after a weak close with a dark candle and T-line in a very negative slope…cannot figure out, what’s the market stance for tomorrow.
Maybe we could see a relief from today’s close. It was pretty negative. Maybe we cannot see any follow trough for tomorrow. What do you think ?
that 6657 is being a strong resistance, even after the markets closed. This morning I marked as an intraday resistance before I bought FTSE, but my stubbornness, thinking that it could be broken easily, as we were at the lows, made me be stopped at b/e in 6649,6 (where I bought it), without booking any profit (my target was 6659,6).
Today another day with flat money. No… let´s see 2 Eur I won today 😀 :D. It’s an impossible market.
I really am frustrated. But we need to fight this. Be patient.
Wait for that former Miss World beauty queen Janet Yellen to speak tmrw 😉
ANd with all that cheap money into the market, how can I not be already rich ?
I sense I’m loosing one time opportunity
And everyone in CNBC… Another all time high and so on. And what about me ? I’m always in the market, but I do not see that 😀 😀
Hope we do rise so there is higher positions to short from
I do not short 🙁
But I surely need to change this. It’s taking the opposite sentiment.
But I have difficulty on doing so.
We maybe be going to test that trend line at 6572 area. We close below the 6663 level
Why do you not like to short?
Looking at POMO day schedule, Thursday we could see more upside. What do you think ?
Ray the tazmanian devil leaving now…over and out….until I trade FTSE index again anyway…GLA! 🙂 Watch out on 21 Nov….big POMO day!
Yes, but Thursday it’s a lot of money too. Don’t you think ?
… Monday even bigger than tomorrow but 21st is the daddy beware
Whats causing this steady rise(not that im complaining im long from 6623)??
Positive divergence in 4 hourly chart, between price and RSI.
ANd here he goes, after a f*** day, now it’s time to go to the moon
Anyone know why Dow j going up Trent ?
Short DOW at 16820… Lets see what happens tomorrow… RSI at 87 its screaming
its already at 830 😀 where is your stop >?
840 and the moon is just there
Huge gap up for tomorrow in FTSE. It needs to come down.
Im hoping as Japan also has a huge gap up, that we’ll see some downside overnight, at least initially. Will be watching as may close out positions and reassess.
short at ftse, what level ?
Looking to short after ftse rises to catch up with that bstrd DOW
What levels?
bear flag in the 60 minute chart in FTSE cash
target 6572 😀
No stop as monitoring it. Lets see what happens later
You seem very calm, shorting this market, that knows only one way.
With a f*** close like todayin DOW, I really expect the f***FTSE to go again up, unless it respects that bear flag in 60 minute chart and opens inside it, and breaks below
Anyone short ft n down?
short 6690
The market rise was due too Yellen comments which just show you how fickle these markets really are…
not to mention the german growth is less than expected. Bad news is good news and all.
Yes flash and with the German dax at all time high what could go wrong
So good morning… I see that the bear flag was not respected and a gap up leaving a hole, which I hate – 2 holes at the moment. One when it was going down and now today which is in opposite direction. THe candle yestaerday continues to respecte the downtrend channel where it is
If the tradding range today is tight as this, we will have for tomorrom a huge bounce, if the BULLISH HARAMI is confirmed
Is it only my computer? Why I cannot load http://www.livecharts.co.uk/? Can you load it?
ok, loaded