
Good morning. Well a nice rise yesterday from the 6760 area though I must admit it looked a little dicey with that stop hunt down to 6752, but it finally rose to 6800. The bulls didn’t really build on that rise, though the bears didn’t really do anything either, probably watching the S&P to see if it broke the 2124 resistance area I suspect (it didn’t). Greece looks like its out the headlines now till September, having had enough money thrown at them to tide them over. Generally the Greek China storm has passed for the moment and there is a bit of optimism around. Fickle things markets!
US & Asia Overnight from Bloomberg
Asian stocks headed for the biggest weekly gain since April as the increased likelihood of an end to Greece’s debt crisis bolstered global equities.
The MSCI Asia Pacific Index traded little changed at 144.32 as of 9:03 a.m. in Tokyo, heading for a 2.3 percent advance this week. The Standard & Poor’s 500 Index added 0.8 percent on Thursday, while the Stoxx Europe 600 Index increased 1.4 percent for a seventh day of gains after Greece’s parliament approved bailout measures and the European Central Bank boosted emergency aid. The Shanghai Composite Index closed 0.5 percent higher.
“China worries have died down and Greece is now a non-issue, until September anyway,” said Evan Lucas, Melbourne-based market strategist at LG Ltd. “These points currently give me reason to be more optimistic.”
ECB President Mario Draghi sought to draw a line under the Greek crisis Thursday, confirming the nation’s place in the euro, as the central bank decided to raise funding to its lenders by 900 million euros ($979 million). He also said that Europe’s economic pickup is proceeding and increased uncertainty in financial markets isn’t hindering a broadening of that recovery.
Japan’s Topix index was little changed and Australia’s S&P/ASX 200 Index advanced 0.1 percent. New Zealand’s NZX 50 Index gained 0.3 percent and South Korea’s Kospi index rose 0.4 percent. Futures on Hong Kong’s Hang Seng Index climbed 0.5 percent in most recent trading and contracts on the Hang Seng China Enterprises Index rose 0.7 percent.
E-minis on the S&P 500 were little changed. American investors turned to the raft of earnings reports for clues on the health of the world’s largest economy. Netflix Inc. climbed to a record after reporting a jump in subscribers, while Citigroup Inc. and EBay Inc. advanced after disclosing results. [Ref]
FTSE Outlook
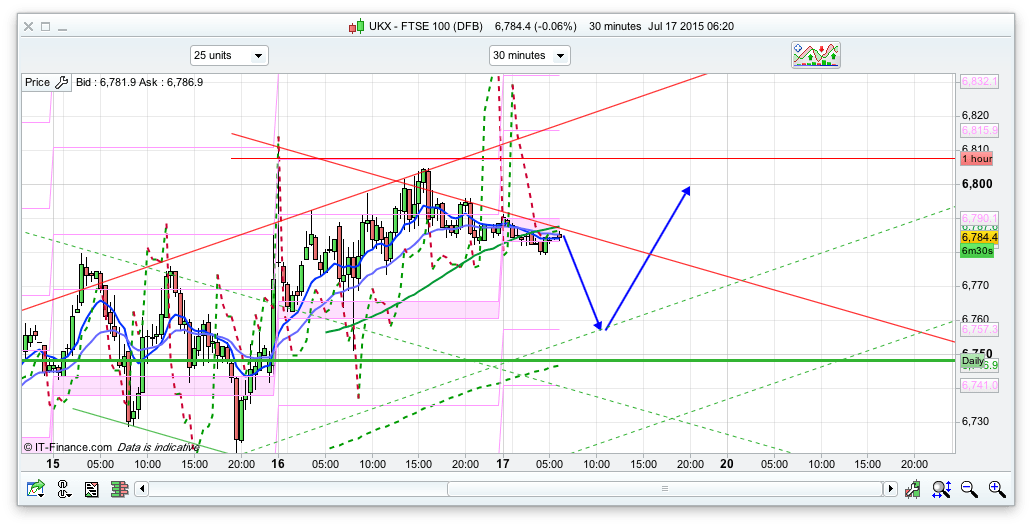
I am thinking we will get a dip and rise today, maybe dipping down to the 6750ish area where we have the 200ema on the 30min, and also the first support from that 30min channel. If that breaks then a dip dow to 6700 is likely, where we have the bottom of the 10 day Raff and the 25ema on the daily chart, we also have the bottom of the 10 day Bianca at 6687 so bear that in mind.The pivot is 6783 for initial support and we are just hovering around this area as I write this (and pretty much been around this area overnight) so it will be an interning open. If the pivot holds then a rise to 6800 is probably going to be first up rather than a drop through the pivot. Either way, I am looking to buy the dips at the moment. I did read yesterday that if the S&P can hold above 2122 then we could be on for a pretty decent rise.
Resistance wise, we have yesterdays high at 6808 then 6859 above that for the top of the 20 day Bianca channel. Not totally sure we will get that high today but you never know. I think the 30min channel looks good for trading off today – resistance at 6825ish and support 6755ish (possibly 6730ish).
Kept my 96 short overnight on the basis that little bullish would occur, and based on this morning’s action have put stop to b/e and limit at 58, as I’m out till this afternoon.
Good luck all.
Cheers tmfp, have a good one
Morning All – Been filled L 6779 (Supertrend Entry on 5 Min) Tgt 6795.
Off out for a bit so I hope to return and find it’s all panned out…
Looking a bit iffy…but was trying something different..
Might be lucky with opex expiry this morning
Back – closed at 6795.
Lol.. one went out with short and the other with long. 🙂
The irony is they could both be right – just on different time frames.
Think we’re going to range trade for several hours 6768 – 6775 – 6800
Yes I think so. Good scalping territory this. Done 47 points this morning. small gap at 90 and one at 70 – can’t lose really when it’s like this.
ZZ – Looking at a 5 min chart there is a gap between Open and Close at 8:00 and then another at 9:25 – are these what you look for ? Do you use a 5min timeframe ?
5 mins and upward are the strongest gaps to go for. I look for candles with a bare bottom (ie no wick). There’s one between the 09.20 and 09.25 candle at 6770.3. BUT … when it’s near a range bottom like this one – they can take ages to fill. I expect this one might fill later today or even tonight, but it’s just one indicator I use. There’s another between the 11.25 and 11.30 candle which is also on the 30 minute timeframe that is screaming to be filled today. So I’m shorting down to it.
11.25-11.30 gap now filled.
gap at 70 filled as well now.
Thanks ZZ – I see…
18052 – Dow Gap Fill Wednesday .
As far as I can see there’s strongish support here…
1 min chart – if the price can breach (close) the 30 MA , I think I’ll probably stick a small L on at 6773 app. Stop 6765.
Change of plan – went L again 6764 – out b/e.
Have good w/e everyone.
Daily FTSE, DAX, Dow — Looking like local max. all round. Dow below. Greek news fails to excite . . . 🙁
Left-click on link: http://i1348.photobucket.com/albums/p736/jmca01/Wall%20Street%20DFB_zpsr4gabgd6.png
Close to getting a sell signal on the 2-hourly. Need a few more bars for it to trigger. Have to wait for Monday’s price action to confirm. Needs to hold below 6765.
ZZ — 30 mins. RSI_10 < 50 and likely to fall? 😀
Anything’s possible – my guess is that this isn’t going down without a fight so I’m expecting more 6775-6805 action. If it clears 6800 convincingly then will have to wait longer before my bear growls. At the moment it’s snoozing with one eye half open.
Just been doing a recce of FTSE 100 equities. Rather a lot poised to fall; so far as I can see. SSE-daily is shown below.
I’ve taken the standard RSI, added a mid-way line, flexibility in specifying line levels and applied a linear regression to the often jagged RSI. Do you approve tmfp? 😀
The main chart shows close (blue line) and my take on Heikin-Ashi.
Left-click on link: http://i1348.photobucket.com/albums/p736/jmca01/SSE%20PLC%20DFB_zpscw4qwibd.png