
FTSE 100 Support 6884 6863 6824 6810 6793 6734 6731
FTSE 100 Resistance 6914 6929 6930 6956 6972
Good morning. Well so much for the NFP estimates! Coming well under at 151k, stock markets took off upwards, as the below expectation data reduced the chance of a rate hike in the US in September. The FTSE blasted up to 6930 (R3) before dropping back but closed the week strongly with high volume and at 6900. The G20 are meeting in China currently while North Korea has fired 3 ballistic missiles to get noticed! The US is closed today for Labor Day, so we may see a slow drift up on the FTSE today before a bit of a drop back tomorrow.
US & Asia Overnight from Bloomberg
Asian stocks rallied the most in eight weeks and higher-yielding currencies led gains against the dollar after weaker-than-expected U.S. jobs data kept a lid on speculation that the Federal Reserve will raise interest rates this month.
Raw-materials producers led gains on the MSCI Asia Pacific Index, while and Hong Kong’s Hang Seng Index climbed to its highest in a year. South Korea’s won advanced to a two-week high and New Zealand’s dollar appreciated for a fourth day. The yen strengthened following comments by the head of Japan’s central bank, while oil fell as the world’s two biggest producers stopped short of making concrete proposals to control output. Financial markets in the Canada, India and the U.S. are shut on Monday for holidays.
While Friday’s U.S. payrolls data showed hiring moderated more than economists forecast in August, the estimate of the number of jobs added in July was revised higher and investors still see a significant risk of a September interest-rate increase. The chance of the Fed hiking borrowing costs this month ended last week at 32 percent in the futures market, having been 34 percent on Thursday. The probability fell briefly to 20 percent in the wake of the data.
“The interpretation of the payrolls data is a bit mixed; it has missed expectations but it’s not terrible and it’s certainly above the run rate that is needed to keep the unemployment rate stable,” said Sim Moh Siong, a currency strategist at Bank of Singapore Ltd. “I’m still wary about the Fed tightening risk.”
China’s services output picked up in August, data showed Monday, and a comparable gauge for the euro area is also forecast to show improvement. Bank of Japan Governor Haruhiko Kuroda ruled out cutting monetary stimulus in a speech he gave in Tokyo and reiterated that there’s scope for existing policy tools to be loosened further if needed. Leaders of the Group of 20 nations are attending an annual summit, which is being held this time in Hangzhou, China.
Stocks
The MSCI Asia Pacific Index added 1.4 percent as of 1:04 p.m. Tokyo time. The Hang Seng Index rallied 1.7 percent, while benchmarks in Australia, South Korea and Taiwan rose the most in eight weeks. Japan’s Topix index added 0.8 percent as exporters advanced following Friday’s retreat in the yen. Toyota Motor Corp. climbed to its highest since February in Tokyo and Sony Corp. rose to levels last seen in November.
“The U.S. jobs data wasn’t something that greatly changed the outlook for a rate hike,” said Seiji Iwama, a fund manager with Daiwa SB Investments in Tokyo. “While expectations for monetary policy remained largely unchanged, we’ve gained more clarity on the situation with additional data, and the yen is weakening.”
Futures on the S&P 500 Index gained 0.2 percent, after the underlying gauge advanced 0.4 percent in the last session.
American employers added 151,000 workers to nonfarm payrolls in August, below the 180,000 projected by economists. The increase came in the wake of a jump in July that was revised up to 275,000. Richmond Fed President Jeffrey Lacker said Friday the message he took from the August data was that “labor markets are continuing to tighten.” He called the report “reasonably strong.”
Currencies
The Bloomberg Dollar Spot Index, a gauge of the greenback against 10 major peers, fell 0.2 percent after edging up 0.1 percent in the last session. The measure slid as much as 0.5 percent after the payrolls data, before reversing its decline.
“The disappointing August nonfarm payrolls report essentially reduced the risk or delayed a September fed funds rate hike,” said Elias Haddad, a senior currency strategist at Commonwealth Bank of Australia in Sydney. “That usually supports the risky assets like the high-yielding currencies” of Australia and New Zealand, he said.
The kiwi, which offers the highest yield among Group of 10 currencies, gained 0.6 percent, and Australia’s dollar rose 0.3 percent. South Korea’s won led gains in Asia with a 0.8 percent advance.
Japan’s yen was up 0.3 percent, after sliding 2 percent last week. Kuroda said Monday that some policy suggestions can’t be done legally or should not be done, such as directly underwriting government bonds and monetizing fiscal deficits.
Commodities
Crude fell as much as 0.9 percent in New York after Saudi Arabia and Russia stopped short of offering detailed plans to stabilize oil prices after Deputy Crown Prince Mohammed bin Salman and President Vladimir Putin met in China on Sunday. The price jumped 3 percent on Friday, the most in two weeks, after Putin said he’d like OPEC and Russia to agree to an output freeze and may propose the plan to the Saudi leader when they met.
Gold for immediate delivery declined 0.1 percent, after rallying 0.9 percent on Friday following the payrolls data.
Aluminum rose from its lowest close since July in London, while lead, tin and zinc traded near their highest levels in more than a year.
Bonds
Australia’s sovereign bonds due in a decade fell, pushing their yield up by five basis points to a two-week high of 1.90 percent. The nation’s central bank is forecast to keep the benchmark interest rate unchanged at Governor Glenn Stevens’s final policy meeting on Tuesday as policy makers hang on the U.S. Federal Reserve’s next move.
Japanese long-term bonds fell, with 30-year debt adding to its biggest weekly loss in almost 2 1/2 years, as investors prepared to bid at an auction of the securities Tuesday. The rout is being driven by speculation the Bank of Japan will reduce its bond-buying program at its next policy meeting now that it owns a third of the nation’s government debt. Kuroda said Monday he doesn’t share the view there’s a limit to monetary easing. “Unless Governor Kuroda directly rules out scaling back bond purchases, the market will continue to hold that as a possibility,” said Shuichi Ohsaki, the chief rates strategist at Bank of America Corp.’s Merrill Lynch unit in Tokyo. “Selling of longer-dated debt is likely ahead of tomorrow’s 30-year auction.”
The cost of insuring corporate and sovereign bonds against default in the Asia-Pacific region dropped the most in more than a week, according to prices from Nomura Holdings Inc. and data provider CMA. [Bloomberg]
FTSE 100 Outlook and Prediction
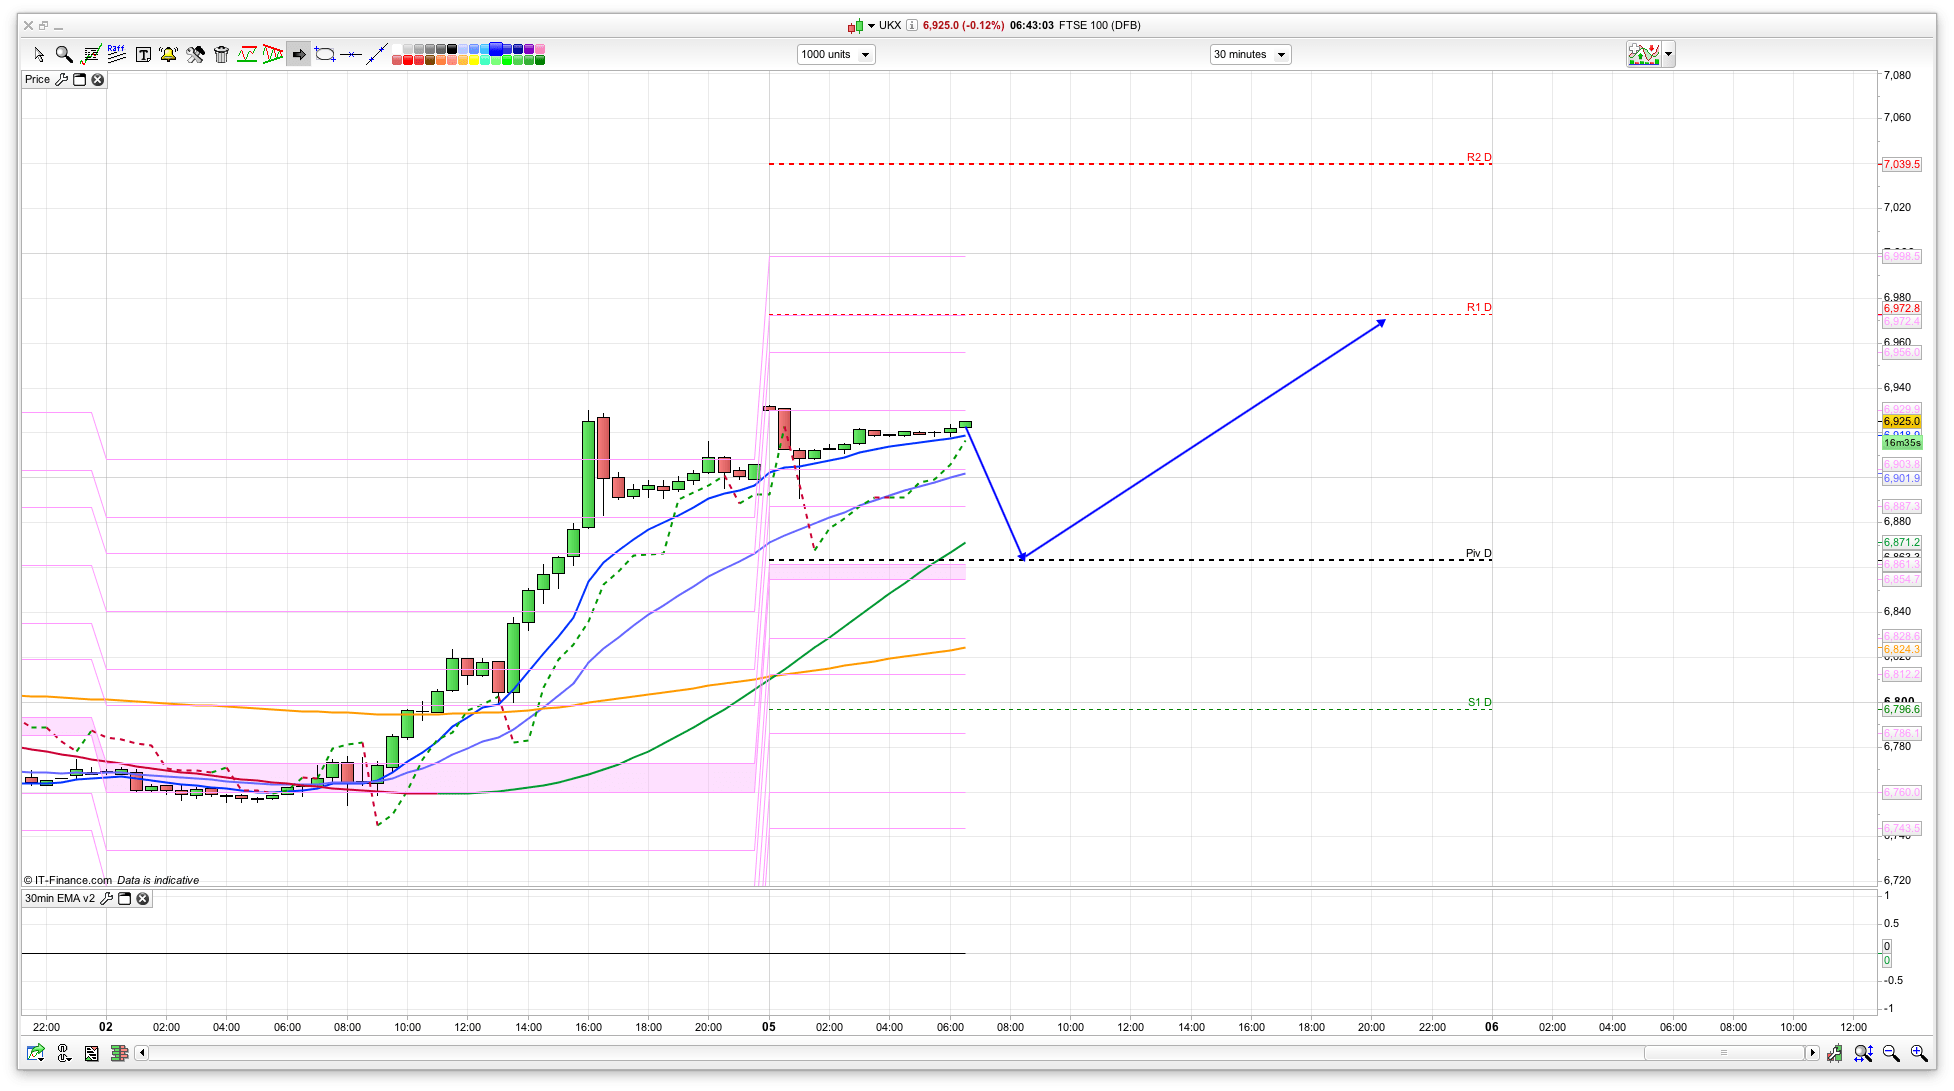
Usually, and I stress usually, if the US is closed we tend to have a fairly flat day, but after Friday’s antics we may well see a bit of a rise higher. However the bulls need to break the 6930 area of resistance first, which is where we dropped back from on Friday (so would be a double top) and we also have a fib level and the Raff channels for resistance here. The 2 hour chart (as you would expect) is now bullish again after that rise, with support at 6810 and 6793.
I have plotted an initial dip down to the pivot area at 6860 before another rise to the 6930 area and possibly higher for today. I am not sure that it will be so bearish that the 2 hour support areas get tested but if they do then the 6810/6815 area is worth a long. Not a lot of high impact news today, though we do have the UK PMI later this week.
So fairly simple plan really, with 6930 being the key resistance level, and 6865 then 6810 as support.
The last few days of postings have been interesting, and it looks like others also appreciated them.
I have tended not to look into this site since my last ” throw in the towel” after a heavy loss. Too much of “went short – went long” after the event, and the usual ” made 150 points on short from yesterday”
However the past few days comments were a refreshing change, so I thought i would post my trade – AS I TRADED IT, on Friday with reasons and my opinion for doing it.
I found that I felt better as I posted my trade and best of all – I was able to keep focused, as if I was being watched and being judged. Staying focused while all alone with only your PC is difficult and I was thinking about it all weekend. I hope people do not mind me vocalizing my trades live !
pls give your comments on this esp the objections
much appreciated
Good points JSft — retrospective claims might be therapeutic, but they are of no practical use to anyone else! 😀
Love to see others opinions and live trades on here jsft… tmfp used to be good at managing that.
I struggle to get them out live as I average into them (or scalp around core position) so it might give people a bad steer as to what I’m actually doing…
I’ll try to do more though.
Hi JSft, I welcome your thoughts and comments. It’s good to share. If we disagree then the debate is always healthy and adds learning.
Morning guys ! its always good to share your thoughts JSft!! long from 74
came out @ 90 long again from @ 76
Looks like buyers are back the FTSE showing strength.. Lets see if it gets pushed back to the 6875 area… could be a buy..
I would normally hedge my short with a long but when it’s this high the risk is getting stuck in a long that if it dumps you will never get out.
Hedges are great mid band as the fluctuation means you can pull but this high you are just locking in your loss if your in a bad short.
The FTSE will come down at some point so my plan is to wait and pull at stages as it does. I won’t buy now until below 6750 . But thats my thought.
When i think the market is disconnected I ignore technicals and go with my gut…perhaps that’s my shortfall 🙂
Morko
I have to agree with you on hedging…. .. Fridays hike up would of killed off a lot of people who were short.. The only people left will be long, looking to get out at 7000… This to me is a prime set up for a big leg down…
Just curious Marko and others who hedge
?? why ??
I tend when FTSE is at (or what I think is) a mid level to long and short at support and resistance levels, as the price moves up and down you pull and add accordingly. I make about 250 pts a week on average but the draw back is you can get caught in, hence why I don’t hedge a short with a long when the price is near all time highs.And you need a fair amount of funds to cover it.
Also hedging can increases margin and lower risk if in a bad trade but I tend not to do that as its best to just kill it or set stops.
Not sure I explained it too well but feel free to ask more. It’s the method I use, not that efficient but it works for me.
Why don’t you exit rather than hedge?
still not quite sure what you mean as a hedge is a long when short or short when long?
Yeah – hedging on same product doesn’t make sense to me – i have tried it on occasion, but just costs me more spread as far as i can tell 🙂
This may just mean that I don’t get it properly…
Not sure I have explained it well. I will try and annotate an example and attach a link. There is a technical term for it, again will look up and post.
It’s s method of covering the market movement range within a channel and involves being in at multiple points at long and shorts so that any movement is technically caught. The skill is selecting the channel and where not to go long or short – sorry still don’t think I’m explaining well. It works though. 🙂
Hi morko,
I currently day trade the FTSE and am always looking for new ways to extract points from the market – it would be good to see you explain exactly how you use this strategy 🙂
Surely if you are simply looking for channels, and then taking a long and a short position near the mid point, this is no different from waiting until the market reaches either support or resistance of the channel and then going short or long depending on which level the market hits? With the strategy you mention surely you are always at breakeven until this reversal point anyway?
I’m not looking to criticise at all I’m just interested to know how it works as it clearly sounds like it is for you!
Cheers
Hi SJA,
I will log on my PC rather than on iPhone and write an example. Give me 30mins.
I would be glad of feedback as its not without its issues this method.
Anyone know what the dividend is in terms of points for the FTSE this week?
2.1 I believe..
Thanks, if the FTSE doesn’t see 6815 then I will be hit, but it’s only small so no bother.
Lol, this is definitely therapeutic — quite interesting though!
https://td.md.it-finance.com/ProRealTime_V10_2/display_chartimage.phtml?name=wx3lbxhbnqh8mlut508f286i9&type=png&purpose=file
Ok here we go then..
1. determine then long, medium and short range channel, from this decide what the mid point is. So for FTSE i would say that 7100 – 6500 was the channel, mid being about 6800.
2. Its then a case of how much money you have, in short you need to break this range into divisions or a grid. The more divisions the more money you need as it will mean the more you have to add in. i.e every 100 pts but it could also be off support resistance lines will.
3. It maybe then that I would buy at every 100 points from 6500 to say 6900 (just after mid) and short from 7100 every hundred points to 670 (just below mid).
Example. The price is 6600 – so I long at say £4pt as it rises I will take out at every 100pts, (or earlier if i think its peaked). If it falls to 6600 again I will add £1 pt again, If it then rises to say 6800 i take every 100 as before but then add a short at 6800 If it then rises to 6900 I stop adding longs but add another shorts. If it then falls to 6800 I take the £1 short out, if it keeps falling to 6700 I take the last short £1 pt out and add a buy.
I thinks its called grid trading??? It isn’t as clean cut as above as I use Support and resistance levels to set the divisions, also you need to constantly adjust the mid.
Soooo with this I bet heavy on low buys, and short heavy if price is high, I size out the at the levels.
Issues are you can get locked in and it requires a biggish account. But if you ca afford to add every 50 pts and set the channel right you can make a lot, and pick up alot of points.
Thats it…please give me opinions
Thanks morko, appreciate that, shall read carefully. Have done some work on custom pivots and levels which could be relevant.
Search grid trading…there’s a good example from Admiral but I can’t seem to add the link
Thanks for the explanation.
I see some problems with it however!
1. It appears to be a mathematical way of trading purely based on numbers and the random movements of the market would work against this – or the algo PhD guys at the hedge funds would have used this and you would have noticed the patterns it would form.
2. The negative side of the system would arise as you are bringing another layer of complexity to an already irregular set of random moves
3. After all we are trying to simplify the system to make it possible to capture what after all is a vertical move
4. when you look at it – all you are doing by hedging – is delaying when you get out of a losing bad trade – psychologically it eases the pain – that you have not exited out of a bad trade – which is after all what it is.
5. From another perspective – it appears to be a ” diluted ” version of adding to loosing trades – The worst offence that a trader can do.
6. from No. 5 – A losing trade – is a wrong trade. Why complicate this by bringing another psychological disadvantage to this.
7. I have made stupid mistakes during all my trading years ( that is for another time), and the worst culprit was to adding to losing trades. – hedging appears to be a watered down version of this.
8. Since losing my account for the umpteenth time – one thing is to simplify the system. When you are wrong – get out fast ( 6-8 points ) When you are correct – Build up your position. aka richard dennis / turtles
——-
This is just my opinion. may be just a lot of garbage – but I truly beleive – simplify the game of trading – dont bring in another layer of complexity
JSft says:
4th September 2016 at 9:49 pm
Just a comment after a few hours of analysing
1. Market looks very much like heading to 7000
2. 6870 / 60 should hold for any down moves
3. without the US in play on monday – ftse as well as all the EU will try to anticipate a US rate to remain stagnat till atleast 2017
4. Fridays move was a True Breakout and this type of breakout will move a few 100’s points
5. all in all – a positive day is being signalled by the market and any breakout out of 6930 – is where I plan to load up
———————————–
Nothing much has changed – bar 24 hrs
so hopefully we will get a nice trade from 6930
Hi JSft, I appreciate your opinion and time taken to give feedback.
I will say I’m not that regimented within and tend to use it in line with support and resistance break outs. It does really ease the physiological factor for me at least.
its a different mentality from looking at s trade from a win or loose. I’m not hedging a lose but covering when the price reversed. The Admiral site explains it well.
Im not buying or selling its just what fits me. I have considerably multiplied my account using it but It’s not to be considered as automated or closed loop. I spend a lot of time charting and considering the buy and sell levels depending on market volume and movement. And I reiterate I don’t use it rigidly as my gut does interject ( often for the worse). I also trade using other method when this doesn’t suit.
I would like to add…that today’s low is not a support line..support is at 6800… I’m still short and holding..im not justifing my position…there are to I much press saying 20000 on the Dow..I’m expecting a crash…if you are expecting 7000 make sue you use the granateed stop…
I’m looking at 6850 to 6838 as decision point to hedge my short…above 6930 you should be long….
Hi George, you are no doubt right about longs after 6930 but it’s not for me, it violates my logic, ( I know the market isn’t logical) but no harm in sitting out – good luck though. I will no doubt regret it when it’s st 7300
Cheers for the explanation Morko!
I must say, the best thing I’ve learnt recently looks very like ‘adding to a losing position’… I split my trades into 3 clips and average as it goes against me. It probably also has the effect that my actual hard stop level is 3x further away than how it used to be, so I get stopped out way less (eg 30pt stop on dax now instead of 10-15 before).
Thanks inoodle, the key is money management. I always ensure that I am covered including my going in points to 5400 to 7300.
Not sure how well I explained it, but it works for me. I’m not always able to sit and watch due to work commitments so I have to have a method that works whilst I’m not watching it, that I have confidence works so whilst I’m working I don’t have to worry. I have quite a stressful full on job, I also spend lots of time in planes with no internet so this is key.