
17th October 2017
Gold dropped below the 1300 level later in the evening yesterday as speculation climbed that the next head of the Federal Reserve will be more hawkish. With the bulls failure to break above 7565 that could well be the sign that we are on a leg down now to below 7500 and with some resistance this morning at 7547 we might see a bit more bearishness today. We do have Carney appearing before the UK Treasury Committee today at 09:15 as well as CPI data at 09:30.
FTSE 100 Outlook and Prediction
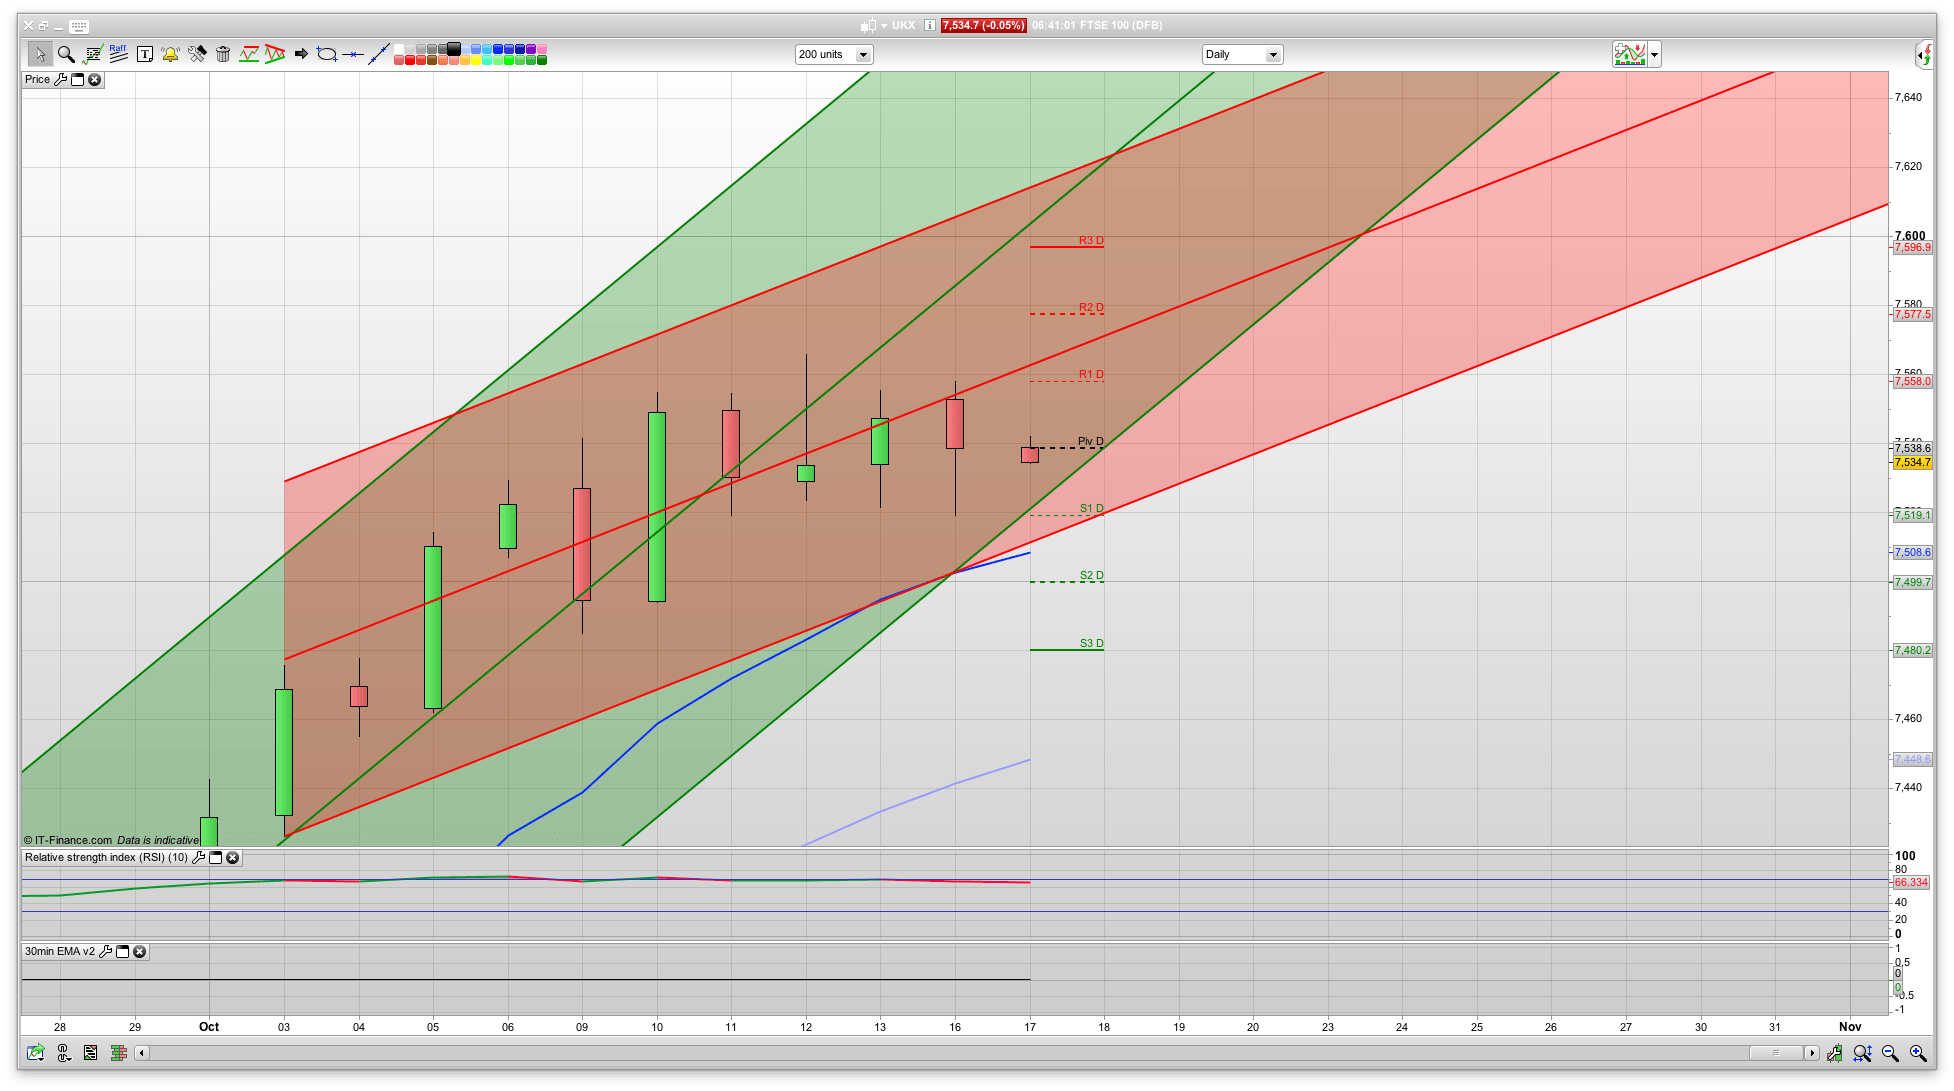
With the bulls failing to break above the main resistance area we have formed a double top at 7565 now so could well see a bit of a pullback down to the daily support area at 7449, before another attempt to push higher. If the bears were to break that level then we may well have set the high for the moment. The 2 hour chart has gone bearish after that drop yesterday and is showing resistance at the 7547 level, with a red coral trend line at 7549. I am thinking that the bulls may struggle to break above this level today and therefore a short here makes sense. If they were to break it then I am watching 7565 and 7600 for the next resistance areas of note.
We didn’t get much of a bull Monday yesterday for the first time in a while so the bulls might well be running out of steam in the short term, and a trip down to 7500 in the very short term looks likely. It will also be interesting to see what Carney says at the Committee later in terms of further rate movements as it now sounds like he is looking at a rise in November. When he last cut he was mooting about reducing to zero so a bit of a change of tune. Quandary though – deal with inflation or leave low to keep the economy slightly buoyant.
Membership
Want more detailed analysis for FTSE 100, DAX, Gold and S&P? Then please join our active members community.
What you get
- Daily Analysis pre market open (sent around 7am each day) for FTSE, DAX, Gold and S&P.
- Daily email pre market includes my trading plan for the day including ORDER levels, with stops and targets/limits
- WhatsApp and webinars group membership for discussion and realtime trade updates
Managed to break the 520 support level. I think we range between 7495-7530 for today now. With the hourly oversold, 7490-7500 shouldn’t get broken cleanly today without a minor bounce (Max 7535 I would think).
35 broken on the trend, maybe 7550 here.
BTD still works. Why did you tell people against it? Nice long off S3 12967 on Dax.
I’m long from 11.3 and 19…
Looking for retest of 50 on cable move…
If we can break through 1.3250 with any conviction on cable Ftse might test the 60s…..
RSI on Ftse 2 hourly around 42.2 and ascending slowly and most of the time this month it’s spent above 57.7…. Probabilities look favourable for gains to me…
RSI on 5 min getting toppy around 73.5…. Holding for a consolidation before move continues…good luck all…
Morning all if can please explain CPI to FTSE relation! would be helpful
When sterling goes up FTSE goes down… simples
I’ve been on the bench for the last ten days. Small shorts on american indices didn’t work out due to the excruciatingly slow grind higher.
Happy for now to just wait and see, rather than get whipsawed.
Still holding a bit of long EURGBP that I should have dumped above 90, and it’s under water now. Not a major problem I think, even with a rate rise. Will just sit it out for some more bad brexit news to surface.
All I will say is I still wouldnt short FTSE and an assault on 7600 would be no surprise.
No position here but note strength of US markets which have broken higher yet again.
If you look at the Daily Dow chart it’s well overbought but look at the weekly…..it’s just in overbought territory but look at Feb 17 how much higher the RSI went compared to now……I estimate it’s possible we could see 23800 on Dow as crazy as it seems..,
Good you got the ride. I am at dentist today, will be able to join after 1.00 in no anesthetic will be used.
All the best Jack good luck…
Keep selling the rallies I think. Feels like we’re rolling over on the daily. Dow is due a pullback, each time it’s approached or slightly exceeded a 1000 mark it’s sold off a couple of percent so think the odds are good it goes back to 22600 soon.
I can see why you think it’s rolling over on the daily…..and as for the Dow I understand your thinking from a rational perspective but as we know markets are not rational…….I think you will be surprised how much higher we go….be interesting to see how it plays out …..
Out at 43.3 on RSI 3 min.
Nice!
Same. No idea why but that is irrelevant. If I was forced to take a position it would be long. Theres at least one more leg higher in it imo.
FTSE is basically range bound between the 7490-7500 and 7540-50 pivots. I wouldn’t be bullish on it unless it starts taking out 7550 with conviction and even then, 7600 looks resistive just above. So the play is to sell into the top of the range and look for the bottom (or buy the dip this morning if that way inclined). For the Dow, I’m just speculating as the trend is strong.. but it won’t just go up in a straight line forever. RSI has been overbought for a while now and there are negative divergences building. Then compare to the rallies to 20000, 21000, 22000.. it suggests a pullback is due. Might not be a very deep one, but a downwards move nonetheless
I reckon dow will blast through 23000 today and hold it as support.
Mcg I’m really impressed with the way you define areas above which are bullish and below which are bearish……I’m not 100% sure how you do it?…..I think they are pivot points that you work out from the high – open – and close of a particular timeframe….
1 ….. am I correct you are using pivots points ?
2 ….. how often do you recalculate them so as to arrive at levels above which are bullish and below which are bearish?
Thanks ….if you get chance to explain and make it clearer I would appreciate it…
It’s much simpler than that actually. Basically just observing the turning points in the price action. What you’ve defined there as a pivot is correct if you’re calculating the daily pivot. When I say pivot though I’m basically just referring to an inflection point. Typically they tend to be 40-60 points apart. For this years trading range I have: 7090-7100, 7130-7140, 7190-7200, 7250-60, 7290-7300, 7330-40, 7380-7400, 7440, 7480-500, 7540-50 and 7600. Above 7600 I would be long and looking for the first area that gives a reaction to determine what the pivots are above there, but would have a guess that there might be one around 7650. If you look at the chart, a large proportion of the moves reverse at these levels so that’s why I’d buy or sell into them as it allows you to place a stop on the other side and define your risk. Sometimes there are overthrows though. Like the move to 7460s and 7560s at the start of September and last week. For that reason I wouldn’t place too much importance on 7565 here. I think if we break 7550s then it will have a run at 7600. But until that breaks it’s definitely a sell around this area
Oh I see thank you….so you are not working it out mathematically …..more a case of noting the areas which have a much higher probability of the market turning based on observation of the recent price action…..one of the many areas I need to address is I tend to expect a breakout of the current range much more than i expect the previous inflection points to be respected…….more often than not it does turn at the inflection point so although it will break through on occasion I would be better over a period of trades to expect it to turn….not sure why I get convinced of a breakout so much…,I think it’s FOMO ,I have to really fight against that….thanks for explaining and best of luck…
Its called support and resistance.
I tend to go off the feel of the market a hell of a lot…
You confirmed you have know idea what you’re doing apart from plucking numbers out of thin air. Good Luck!
lcarus are you still holding Dow shorts and are you still covered on FTSE at 7550?
Yes holding both shorts. I hedged ftse at 15 and closed just now at 45 for ftse.
The tumbling pound has greatly assisted my gold/ gbp trade today, going up as pound falling faster than gold .
You have to laugh at the inflation data, cant wait to see carney squirm as he fails to put up interest rates next month, the highly paid man who cut them only so recently…
I think markets have accepted for now that no matter the data, low interest rates will be around for a few more years.
No political party can afford to be in power when they go up.
GBP back down to 1.31 this time Anstel 🙂
Yeah I didnt think we would see 1.33 first though CM but cable is on its way down….should break down better under 1.30 …
Soft pound wont hurt ftse
Well here’s a case in point Mcg…..I now think a break of 7550 is in play and I’m long from 47….
It’s looking lively on the hourly…RSI pulled back slightly at 61.3
Slight gain in RSI on 5 min cable chart but weak still around the 30 area….
Nice. Thanks for your sell signal!
Do you think Ftse is going to drop TCG?
I stated the FTSE is showing signs of rolling over on Friday. As MCG says, I’m trading the price action. We’re seeing resistance at lower highs, although they maybe just slightly lower. The break of 7520 was significant to me too today. So if I was to take a swing trade, the high probability set up is sell near 7550 and cash between 7440-7490. I day trade and take 11-15 points based on some technicals on each move. For me it makes no sense in saying FTSE is going to break the trading range and just dart to 7600 and beyond. Unless there is a fundamental reason to justify this.
TAW!!! (Tank and Wank)
No comment….
TAW!!!! Weak close, and finished below the previous days shows the downside is building momentum. Are you out of your long at 7547?
No I’m not out I added at 15…
Stop hunt that..
Lol.. I’d say it’s 75/25 in favour of holding so would rather be short and get out above. Where would you exit longs here?
I will hold them till 7515 …..its goin up its just a matter of when so if I have to hold overnight I will…
Also anstel.. on the sterling view, I’ve got no feel for where it’s going shorter term. But have a look at the daily with the 50, 100 and 200 day moving averages plotted. You’ll see that when it was tanking last year the moving averages were sloped downwards with the 50 day below the 200 day.. that shows you that the momentum was downwards. After we bottomed in Jan time the moving averages turned up and there was a bullish crossover in March. Now they are all pointed upwards and the 50 is higher than the 200. That tells you the long term trend is up so weakness in sterling will probably be bought. Then if you overlay the fundamentals.. the most likely outcome with Brexit is some sort of deal but agreed over a protracted period of time. We’ve got another 18 months to agree so it’s unlikely he plug would be pulled on negotiating any time soon. If an agreement is reached, the risk premium should drop out and expect it to go a lot higher, probably even $1.50 in time. My point is, your call of $1.20 now looks like an outside bet as you’re hoping that something happens politically that’s not in the best interests of either side. It’s possible, but just not probable. It’s the same principle as calling a crash in stocks here shorter term.. unlikely until the moving averages level off and bunch together, and that takes time
Well yes maybe but I think you will find cable will drop….charts do have their place but as I’ve said before they show you the smoke coming out of the ships funnel indicating where the ship has been before…… However, where the ship is heading next has a lot of variables and it’s my view that it’s as much about anticipating the markets next movements regardless of the technical side… As always time will tell so let’s wait and see…..if we all thought the same all the time we wouldn’t have a market so be interesting to see how it plays out….
You were offside all summer but the question is will you be offside for the winter? #winteriscoming
Moving averages are of no significance really, as they are calculated on old data. Same as rsi is simply a derivation of same data. Of course you could play either but not without looking at price / candles, SAR. So theres no point in having these indicators on a chart. They are useless.
There is only one indicator of any use which could be played without looking at horizontal SAR and that is an indicator based on standard deviation such as bollinger or belkhayate.
They forecast turns in price based on the mean for the chosen timeframe, but work better with appropriate candle delimiting a stoploss.
I say that based on experience and not for the sake of argument.
Theres no point having a moving average on a chart, nor a bunch of them in any particular order.
Your trading account wont benefit.
The bollingerbands are based around the 20 sma are they not CM?
Default setting but can choose any number.
its better than playing the ma itselfbecause if you accept that prices revert to the mean they identify high probability counter trend setupx so uou are less likely to be wrongfooted by market swings
Now im not saying thats what i do…it isnt….im just saying that its a bettef way to play ma indicators as you will likely get off to a good start and you could take it from there.
I dont use indicators.
I think reading candles is another really beneficial skill to acquire …..I don’t think its something that can be learned quickly…..there’s a lot to learn for sure..
Nothing to it…just looking for hammers or stars at support and resistance.
Reverse pairs good. And dark cloud cover after a climb very reliable.
I don’t use MAs day to day or on shorter term charts.. but if you just simply plotted the 200 DMA on the spx chart, it shows that the bigger declines start when the line is flat rather than upward sloping as trends weaken before they reverse. So my point is, if Sterling is going to tank, the bullish momentum needs to disappear first and that will show on the chart in the form of sideways price action. Otherwise bulls are in control of cable
I don’t understand FTSE. All is going up FTSE going down. Currently long DAX. Stuff anesthetic: it hurts.
Hope you got back before 2 30
That’s when my internet stopped so was trading off the phone. Not great
It all crashed omg
Got out ok. Not great to trade with pain.
Hi all, mega busy at mo with other stuff…
I’m long on Dow..looking for 23k punch through and rally
what makes you think it’s just gonna power through?
Normally close orders are set at major price targets like 23k…if It clears them it generally runs up at least 50pts.
Hedged dow
Nice hedge at the top
Just wondered ? Have you got anything constructive to say?
Each to their own I guess. Can see the sarcasm, but can’t help but think it might be a bad time to hedge
Then again it might be a good time to hedge……I think the latter…
As I mentioned earlier I think the Dow could attain 23800… It’s not rational I know. but it’s possible….
Sold Dow here.. don’t usually trade it but worth a go under 23000 as might be a decent drop soon
I’m in too. Worth a short with a tight ish stop. Not 1500 points
Added on the turtle head
Out of 15 long at 36.5 for 21.5pts
Closed Dow long at 96…
Didn’t have enough to clear the sell orders / bears at 23k.
Will buy the dip tomorrow if there is one. I have no doubt it will pass this level, just look at daily chart and ask why is it stopping now. No evidence of slowing yet.
…any thoughts on gold, got 1260 on my head as buy point…no science just gut ?
Cleared 23k…Argh why did I close 🙁
short dow @00…..just to warn everyone !!